
Figure 8.
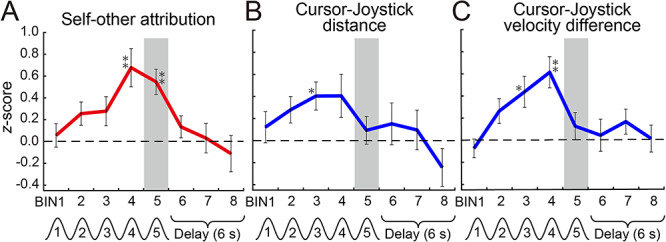
Time courses of z-scores for self-other attribution (A), cursor-joystick distance (B), and velocity difference (C) at the peak voxel (x = 60, y = −34, z = 30 in MNI coordinates) in the right SMG (cluster no. 15 in Fig. 7). Error bars show standard error of the mean. Asterisks indicate z-scores that were significantly larger than zero according to two-tailed one-sample t-test (*: P < 0.01 uncorrected, **: P < 0.05 Bonferroni corrected for multiple comparisons). Each time bin corresponds to a volume scanned every 2 s during the 10-s move and 6-s delay periods. Gray bars highlight the fifth bin (last cycle of the sinusoidal movement). The events denoted under the time bins are shifted by 6 s from the actual time considering the HRD.