
Figure 4.
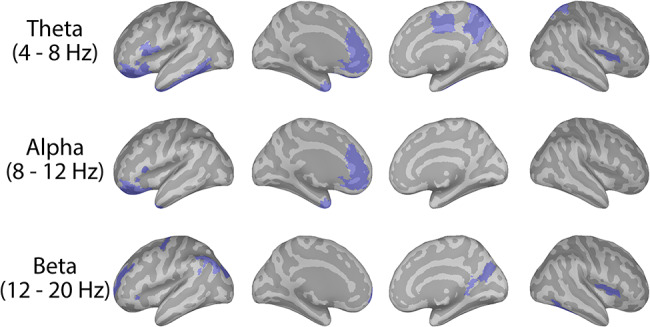
Group differences in functional connectivity between the right DLPFC and other cortical regions at the source level. Cortical maps illustrate which regions (in blue), as defined by the Destrieux Atlas, exhibited significantly greater coherence with the right DLPFC in youth MDD compared to healthy controls, at the uncorrected threshold of P < 0.025. For each participant, the imaginary coherence between each region, as defined by the Destrieux Atlas, and the right DLPFC was calculated, and then averaged within each of the frequency bands of interest (i.e., theta, alpha, and beta). Within each frequency band, independent-sample t-tests were then conducted to assess for which regions the coherence values significantly differed between youth with depression and healthy youth.