
Figure 4.
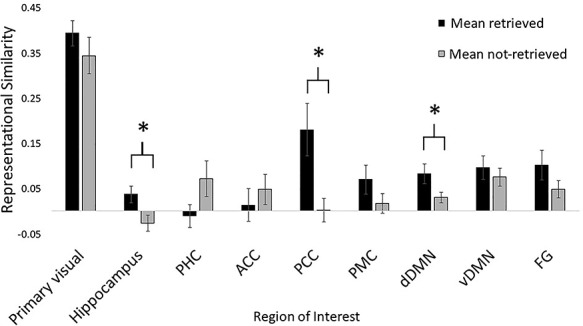
Representational similarity, quantified as Fisher-Z r-values, of average retrieved and not-retrieved episodes within each ROI, collapsed across episodes. *indicates statistical significance (P < 0.05). Error bars reflect the standard error of the mean.