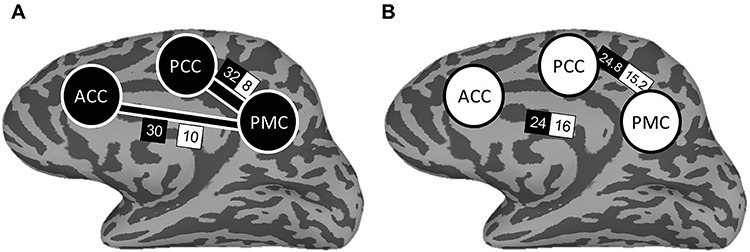
Figure 5.

Depiction of the discrimination network of subsequently retrieved and not-retrieved outcomes based on encoding activity. The network consists of ACC, PCC, and PMC. Panel A depicts the observed frequencies of classifier concordance. Width of connecting bars between regions depicts the magnitude of Chi-Square statistic for classifier predictions. Panel B depicts the expected frequencies of classifier concordance if the regions were independent. Values within black boxes indicate the frequency of classifier agreement; values within white boxes indicate the frequency of disagreement.
