
Figure 10.
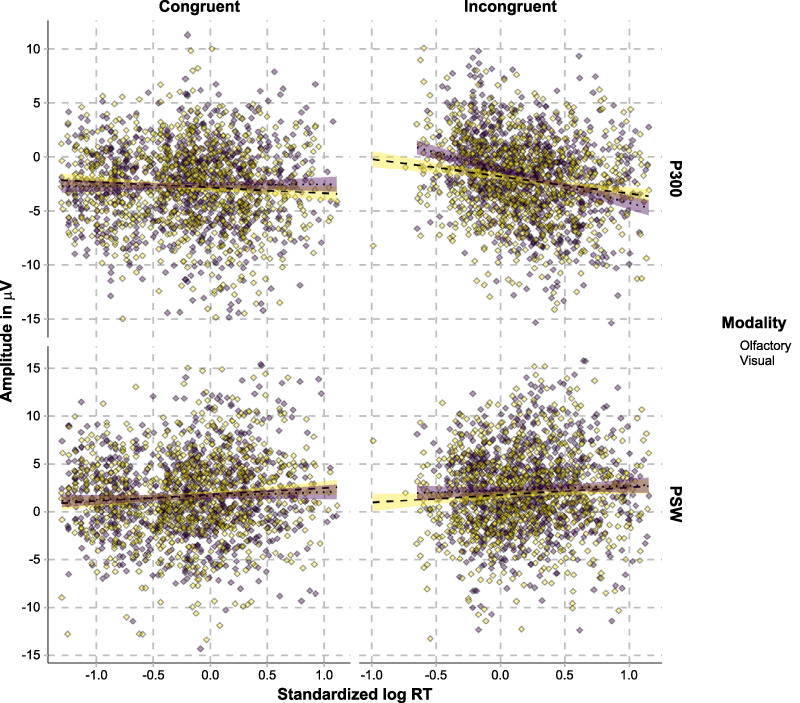
Correlations between mean ERP amplitudes in the P300 (CF ROI) and the PSW (CO ROI) time windows, differentiated on the basis of congruence and modality.
Official websites use .gov
A
.gov website belongs to an official
government organization in the United States.
Secure .gov websites use HTTPS
A lock (
) or https:// means you've safely
connected to the .gov website. Share sensitive
information only on official, secure websites.
Correlations between mean ERP amplitudes in the P300 (CF ROI) and the PSW (CO ROI) time windows, differentiated on the basis of congruence and modality.