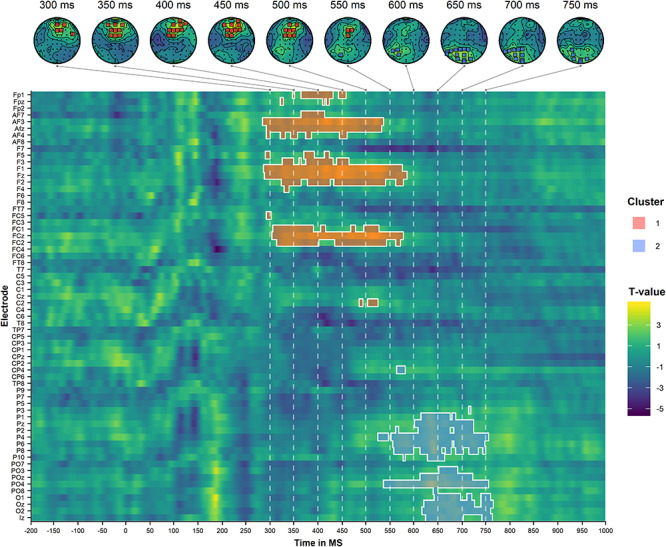
Figure 5.

Results of the cluster-based permutation analysis of the auditory target ERPs, comparing the incongruent condition to the congruent condition (collapsed over modality). The top panel illustrates the scalp topographies of the identified clusters (ordered by size) at selected time points. The bottom panel illustrates the spatiotemporal distribution of the identified clusters. The dashed lines correspond to the selected time points of the topoplots in the upper panel.
