Figure 4.

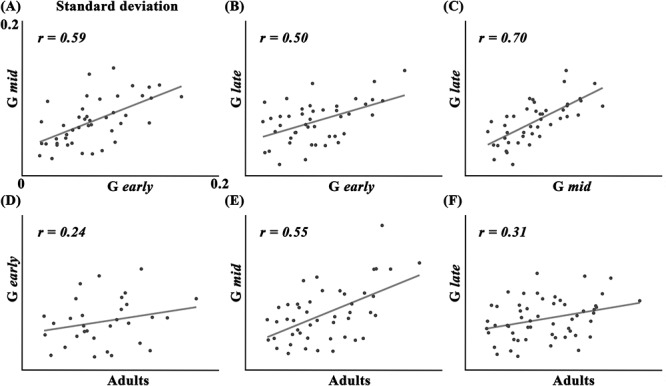
Correlation of standard deviation of pit coordinates between subgroups. (A) Gearly and Gmid, (B) Gearly and Glate, (C) Gmid and Glate, (D) Gearly and adults, (E) Gmid and adults, and (F) Glate and adults.

Correlation of standard deviation of pit coordinates between subgroups. (A) Gearly and Gmid, (B) Gearly and Glate, (C) Gmid and Glate, (D) Gearly and adults, (E) Gmid and adults, and (F) Glate and adults.