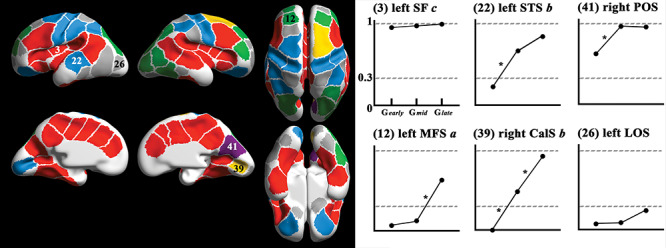
Figure 5.

Cluster-wise results of pit frequency and chi-square tests. The colors in the clusters on the surface (left) indicating changes of pit frequency among fetal subgroups and examples of changes of frequency in six clusters are provided (right). Cluster indices and names correspond to those of Figure 1. Colors of the clusters represent the statistics of frequency change. Red: pit frequency in Gearly over 0.3 and no significant change between subgroups. Light blue: significant increase of pit presence using chi-square test from Gearly to Gmid. Purple: both high frequency in Gearly (>0.3) and significant increase of pit presence using chi-square test from Gearly to Gmid. Green: significant increase of pit presence using chi-square test from Gmid to Glate. Yellow: significant increase of pit presence using chi-square test from Gearly to Gmid and from Gmid to Glate. Gray: low frequency in Gearly (<0.3) and no significant change. *: significant change of pit presence (FDR corrected P < 0.05) between two subgroups.
