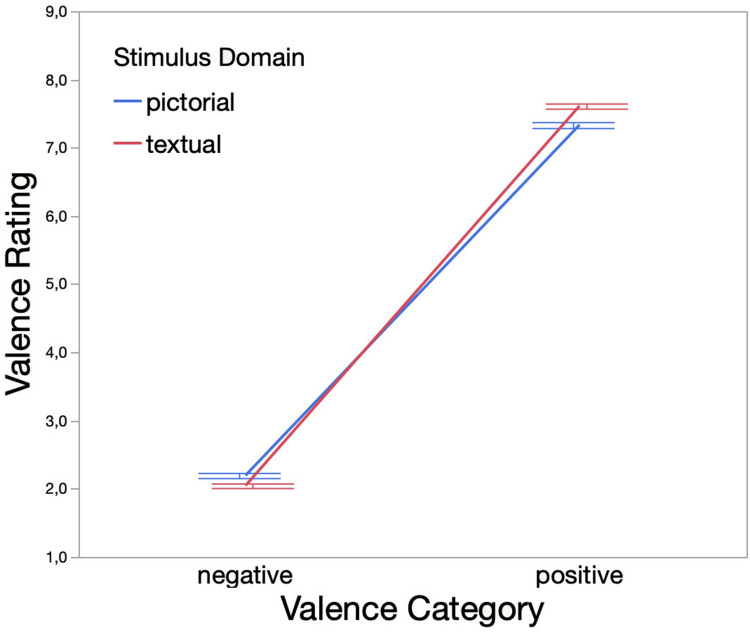
FIGURE 2.
Interaction effect of Valence Category (i.e., negative, positive) and Stimulus Domain (i.e., pictorial, textual) on Valence Rating (assessed on a 9-point rating scale). Error bars denote one standard error from the mean. Descriptive statistics are as follows. Negative valence category: Mpictorial = 2.20, SDpictorial = 1.11, Mtextual = 2.05, SDtextual = 0.97; positive valence category: Mpictorial = 7.33, SDpictorial = 1.27, Mtextual = 7.61, SDtextual = 1.07.

