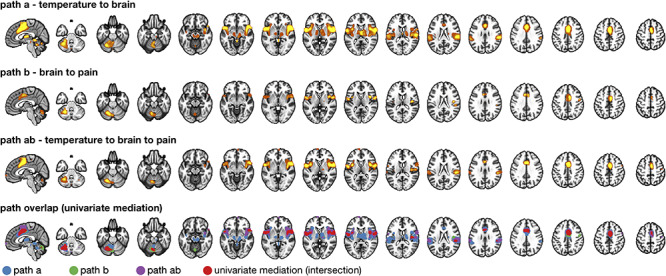
Figure 7.

Comparison with univariate mediation analysis. Top three panels show individually significant voxels for paths  (blue),
  (green), and
  (purple) from a univariate mediation analysis at FDR
  . Panel 4 shows voxels mediating the relationship between temperature and pain, that is, the overlap between the three paths (red).
