
Figure 2.
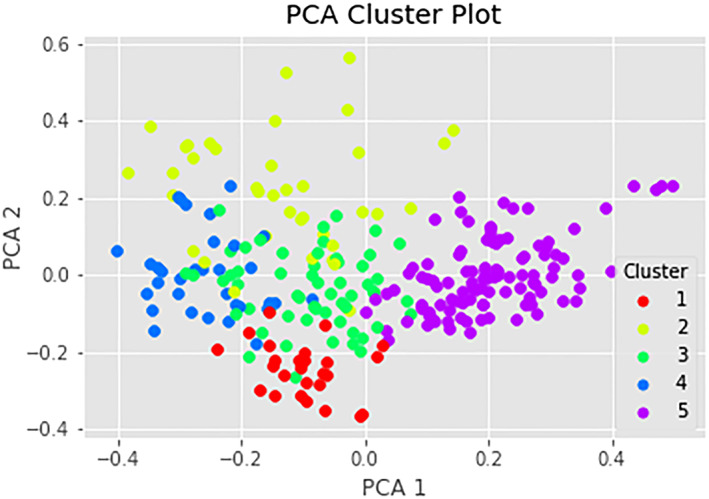
Principle component analysis (PCA) plot with two principal components. Contains 259 data points (articles), divided over five clusters. [Colour figure can be viewed at wileyonlinelibrary.com]
Official websites use .gov
A
.gov website belongs to an official
government organization in the United States.
Secure .gov websites use HTTPS
A lock (
) or https:// means you've safely
connected to the .gov website. Share sensitive
information only on official, secure websites.
Principle component analysis (PCA) plot with two principal components. Contains 259 data points (articles), divided over five clusters. [Colour figure can be viewed at wileyonlinelibrary.com]