
Fig. 1.
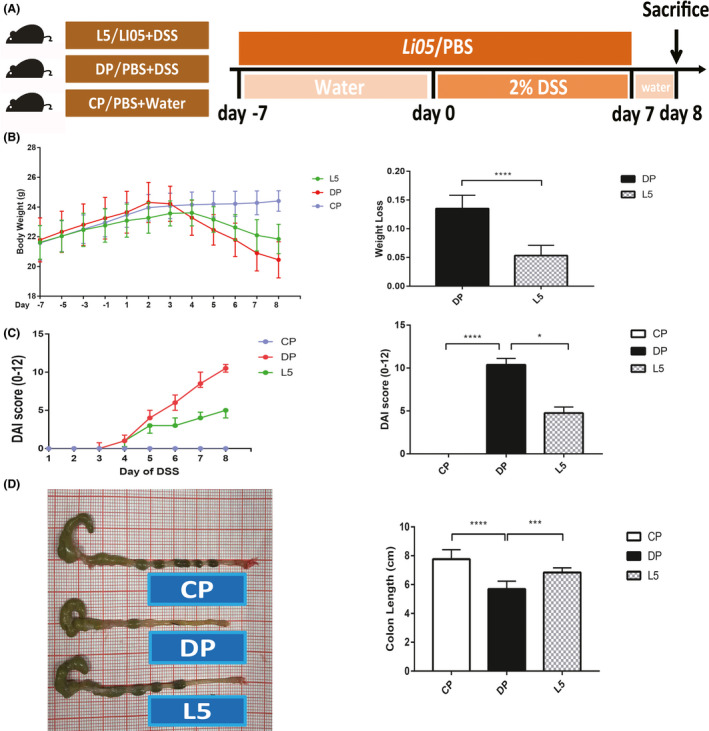
P. pentosaceus LI05 ameliorated DSS‐induced clinical symptoms and intestinal injury in mice.
A. Schematic depicting the design of the animal experiment.
B. The body weights of mice in the three groups recorded from day −7 to day 8 are plotted and presented as mean (SD; left panel). The bar chart represents the weight loss relative to the base weight on day 0 (right panel).
C. The disease activity index (DAI) scores after DSS administration (left panel) and on day 8 (right panel) are shown for the three groups.
D. Representative images of the colon in mice from the three groups (left panel) and the colon length on day 8 (right panel). *P < 0.05, ***P < 0.001 and ****P < 0.0001 according to unpaired t tests with Welch’s correction, Kruskal–Wallis tests and post hoc one‐way ANOVA.