
Fig. 11.
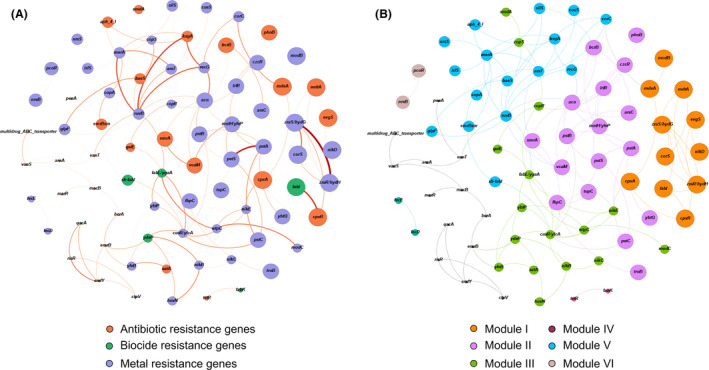
The network analysis showing the co‐occurrence patterns of antibiotic, biocide and metal resistance genes detected in the top 24 taxa.
A. The nodes with different colours represent antibiotic (orange), biocide (green) and metal resistance genes (light purple). The intensity of edges corresponds to the degree of the positive correlations ranging from 0.61 (light orange) to 0.91 (dark red).
B. The nodes with different colours represent the six modularity classes, with the colours of edges corresponding to their respective class: module I (orange), module II (pink), module III (green), module IV (dark red), module V (cyan) and module VI (light brown). A connection represents a strong spearman correlation (P > 0.6) and significant (P < 0.05) correlation (FDR). The size of each node is proportional to the number of connections.