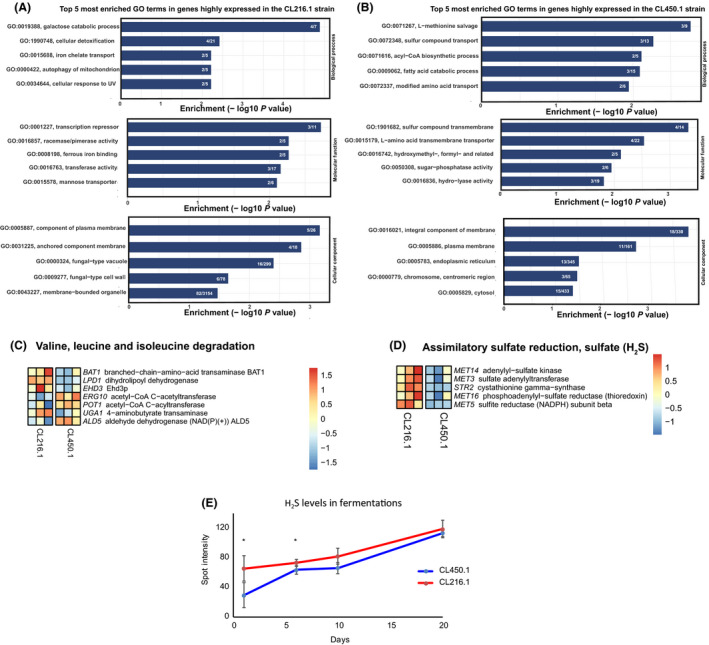
Figure 5.

GO terms and KEGG enrichment analysis of differentially expressed ORFs between S. eubayanus strains in beer wort.
A. Bar plots show the five most enriched GO terms in upregulated DEGs in CL216.1 and (B) CL450.1.
C. Heatmap of ‘Valine, leucine and isoleucine degradation and (D) ‘Assimilatory sulfate reduction, sulfate (H2S)’ KEEG pathways in CL216.1 and CL450.1. Each column represents a replicate (E) H2S production during wort fermentation in 2L tanks.
