Fig. 1.

Characterization of EcNΔflhD mutant.
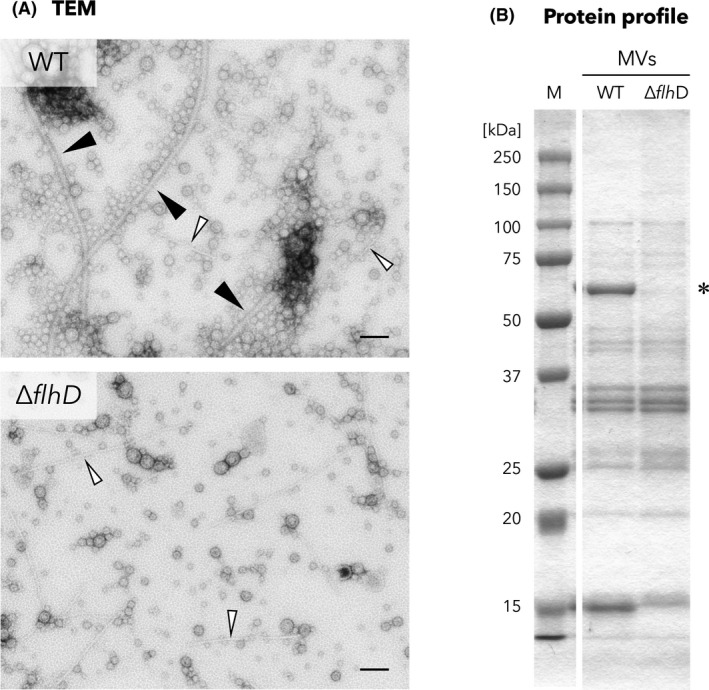
A. TEM images of MV fractions of EcN wild type (WT) and the ΔflhD mutant (ΔflhD). The samples were diluted to a protein concentration of 150 and 60 ng µl−1, respectively, for observation. Black arrowheads and white arrowheads denote flagella and fimbriae respectively. Scale bars represent 100 nm.
B. Protein profiles of MV preparations from WT and ΔflhD. MV samples were analysed by SDS‐PAGE using 12.5% polyacrylamide gels and stained with CBB. The same MV protein amounts were loaded into each lane. ‘M’ represents the marker (precision plus protein all blue standards, Bio‐Rad, Hercules, CA). Asterisk denotes FliC.
