Fig. 2.

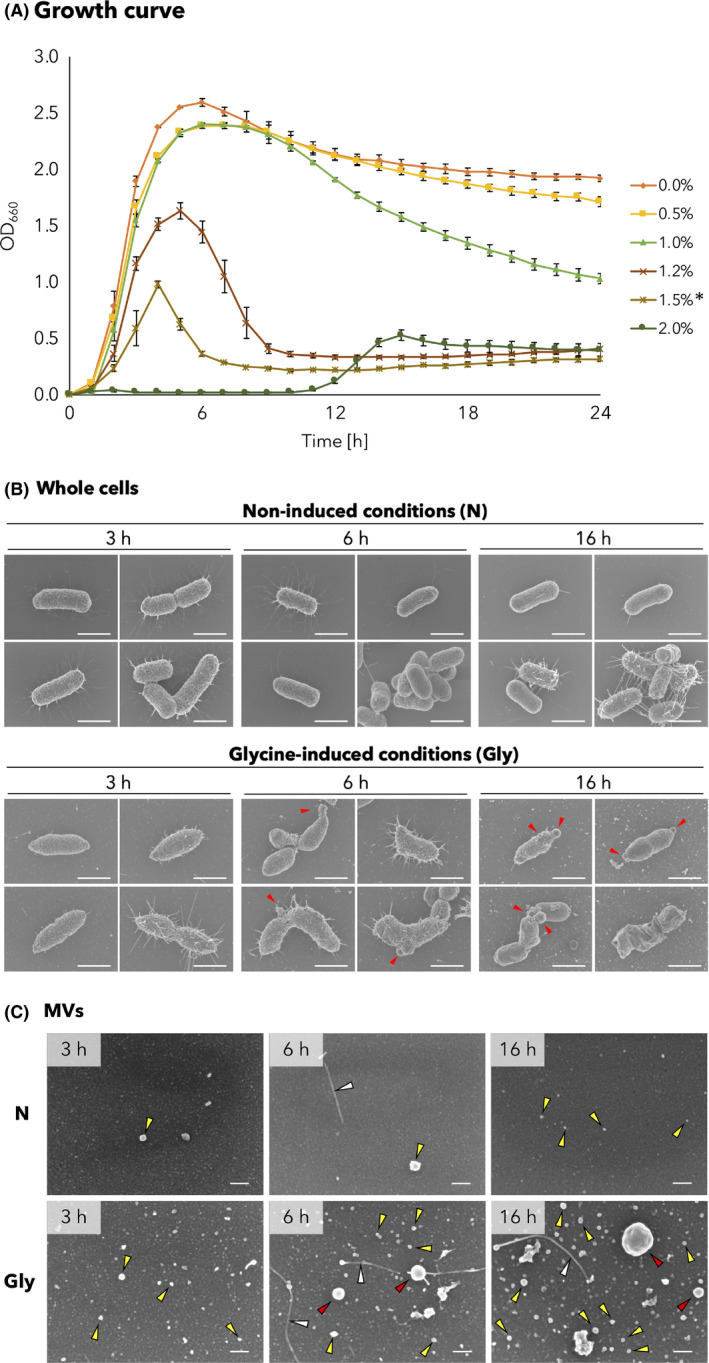
Growth and morphology of whole cells and MVs of EcNΔflhD strain in the absence or presence of glycine.
A. Growth curves of the EcNΔflhD in the absence or presence of glycine at different concentrations. Error bars represent standard error of the mean of three independent experiments. The growth curves were generated by sequential measurement of OD at 660 nm. The cells tended to aggregate when LB broth was supplemented with 1.5% glycine, which is denoted by an asterisk (*).
B. Whole cells of EcNΔflhD cultured in the absence or presence of glycine. The EcNΔflhD was cultured with shaking for 3, 6 and 16 h in LB without [non‐induced conditions (N), top panels] or with 1.0% glycine [glycine‐induced conditions (Gly), bottom panels]. Shown are four representative SEM images of cell appearance at each time point. Red arrowheads show the emergence of large membrane blebs on the bacteria. Scale bars represent 1 μm.
C. MVs of EcNΔflhD cultured in the absence or presence of glycine. SEM images of MVs of the EcNΔflhD cultured for 3, 6 and 16 h in LB without (N) or with 1.0% glycine (Gly). Red, yellow and white arrowheads denote large MVs, small MVs and fimbriae respectively. Scale bars represent 50 nm.
