
Fig. 3.
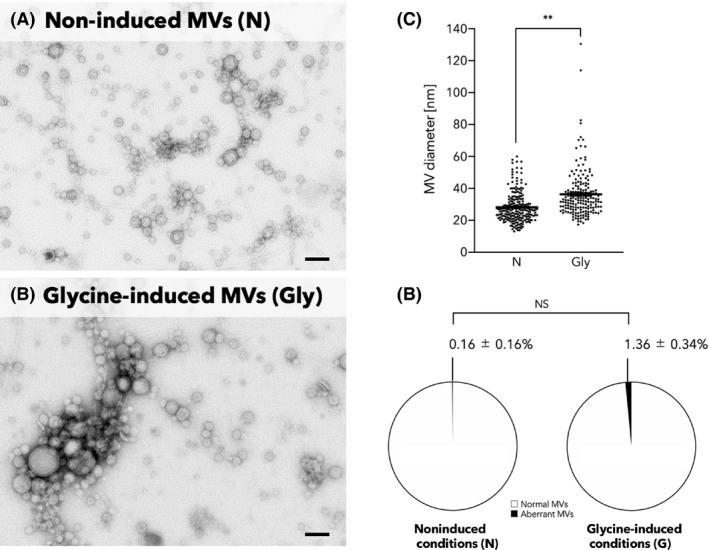
Difference in morphology between non‐induced MVs and glycine‐induced MVs.
A and B. TEM images of MV fractions of the EcNΔflhD cultured in LB media without (A) and with 1.0% glycine (B). The samples standardized at a protein concentration of 60 ng µl−1 were analysed by TEM. Scale bars represent 100 nm.
C. Distribution of the size of MVs. Horizontal bars represent mean values. Statistical analysis was performed using a Mann–Whitney's U‐test (N, n = 213; Gly, n = 181; **P < 0.01).
D. Percentage of aberrant MV numbers to total MV numbers. The number of MVs with aberrant morphology was calculated by counting the number of MVs with aberrant morphology in three randomly extracted 1.1 × 1.4 µm2 TEM images. MV with aberrant morphology was defined as irregular, shrunken and/or flattened membranous structures instead of rounded structures. The mean percentages with standard errors of aberrant MVs to total MVs are indicated on the pie charts. Statistical analysis was performed using unpaired t‐test with Welch's correction (triplicate experiments, NS: not significant).