
Figure 3.
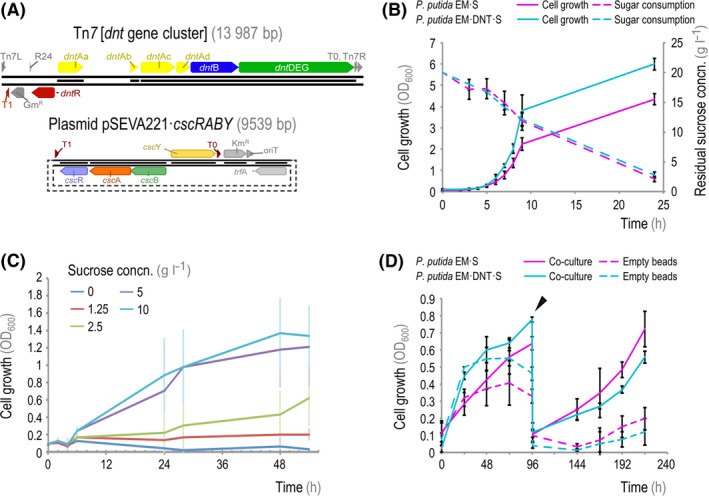
Growth characterization of P. putida strains engineered for sucrose consumption and 2,4‐DNT transformation.
A. Schematic representation of the gene cluster encoding the enzymes involved in 2,4‐DNT degradation from Burkholderia sp. R34, transferred into the P. putida chromosome via Tn7 transposition (top panel), and plasmid pSEVA221·cscRABY (Löwe et al., 2019), encoding the functions needed for sucrose utilization from P. protegens Pf‐5 (bottom panel).
B. Growth and sucrose utilization by engineered P. putida strains in M9 minimal medium containing 20 g l−1 sucrose. Bacterial growth was assessed as the optical density measured at 600 nm (OD600); residual sucrose concentration (concn.) in culture supernatants was determined with an enzymatic assay. (C) Growth of P. putida EM·DNT·S in M3 minimal medium containing different concentrations of sucrose (0, 1.25, 2.5, 5 and 10 g l−1).
D. The growth of P. putida EM·S and P. putida EM·DNT·S, inoculated from overnight cultures with 20 g l−1 sucrose, was monitored with or without encapsulated S. elongatus CscB (indicated as co‐culture). OD600 measurements track only the growth of the P. putida cells (i.e. planktonic cells). At 96 h post‐inoculation (slanted arrowhead), all of the M3 minimal medium was removed and replaced with fresh medium, allowing the residual P. putida cells on the surface of the alginate beads to repopulate the culture. In panels (B) and (C), the mean values for n = 4 are displayed, and error bars represent standard deviations. In panel (D), the mean values for n > 3 are displayed from experiments carried in different days, and error bars represent standard deviations.