Figure 5.

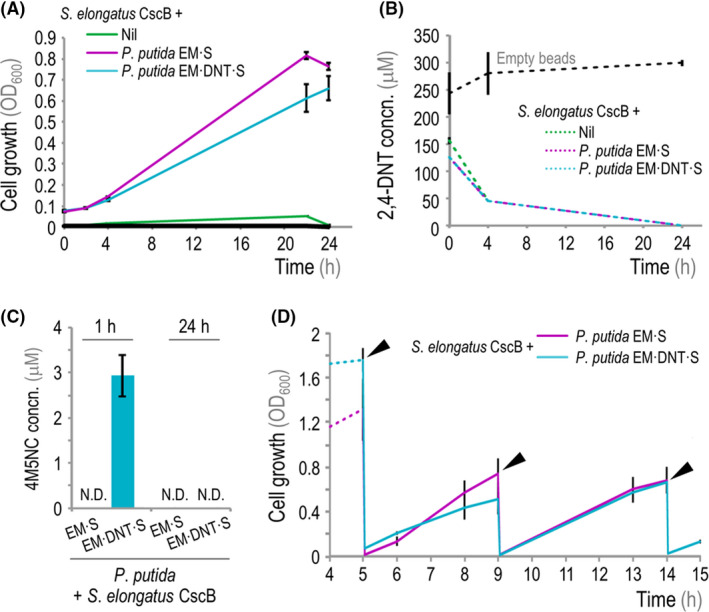
Biotransformation of 2,4‐DNT in co‐cultures of engineered S. elongatus and P. putida.
A. Growth of engineered P. putida strains [assessed as the optical density measured at 600 nm (OD600)] in co‐culture with alginate‐encapsulated S. elongatus CscB in the presence of 250 μM 2,4‐DNT. The black line indicates control experiments with empty beads.
B. GC‐MS analysis of 2,4‐DNT concentration (concn.) in supernatants of co‐cultures during 24 h. 2,4‐DNT concentrations dropped below detectable levels by 24 h post‐inoculation.
C. LC‐MS quantification of 4M5NC concentration (concn.) in supernatants of co‐cultures after addition of 2,4‐DNT at 250 μM at 1 and 24 h post‐inoculation. N.D., not detected.
D. Growth of engineered P. putida strains in long‐term co‐cultures with encapsulated S. elongatus CscB. The culture medium was exchanged at each indicated time‐point (slanted arroheads), and IPTG and 2,4‐DNT were added at 1 and 250 μM respectively. In panels (A–C), the mean values for n = 3 are displayed, and error bars represent standard deviations. In panel (D), the mean values for n = 14 are indicated, and error bars represent standard deviations.
