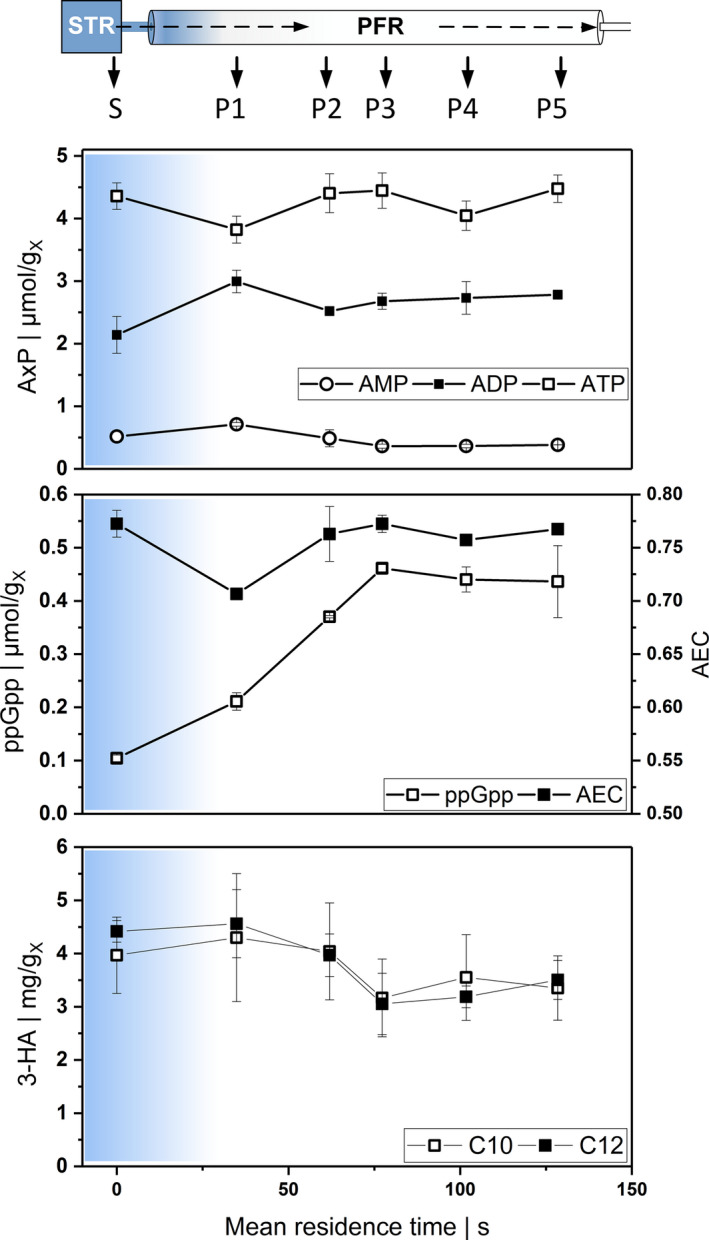
Fig. 2.

Metabolic response to transition from glucose limitation in the STR (S) to depletion (symbolized by blue gradient) and starvation in the PFR (P1‐P5). Samples are withdrawn after 25 h of repeated glucose starvation. X‐axis indicates the mean residence time (s) in the PFR compartment A: intracellular nucleotides AMP, ADP and ATP per gram CDW; (B): ppGpp per gram CDW and adenylate energy charge (AEC) calculated from nucleotides; (C): intracellular concentrations of 3‐hydroxydecanoic acid (C10) and 3‐hydroxydodecanoic acid (C12) per gram CDW.
