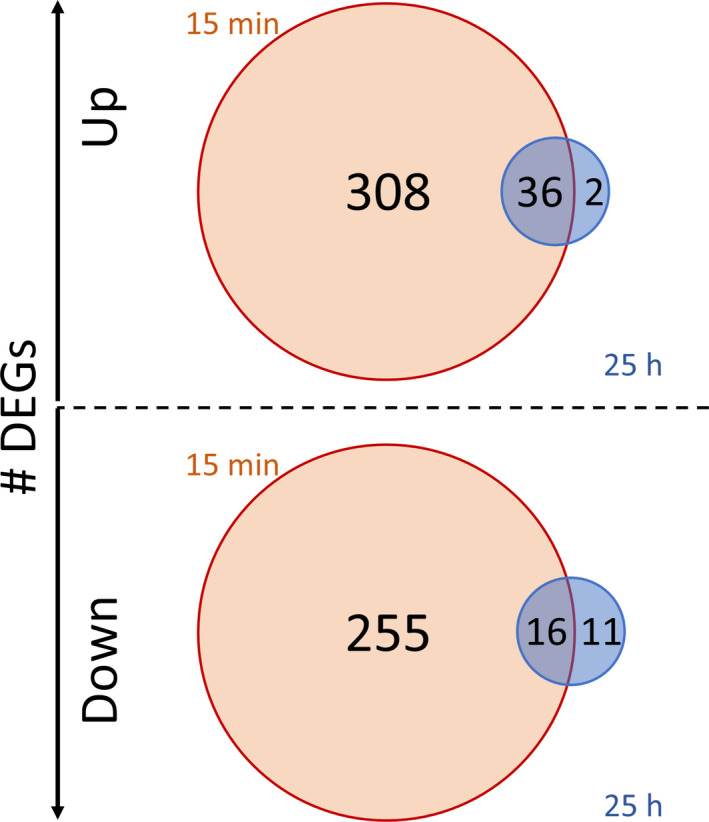
Fig. 7.

Amount of differentially expressed genes (DEGs) (FDR < 0.01) as part of the long‐term response to repeated glucose starvation indicated inside the circles. The gene expression profile in the STR at the late phase (25 h, blue) is compared with the analog profile measured in the early phase (after 15 min, red) in the STR. The intersection indicates the amount of common genes in both phases.
