
Figure 6.
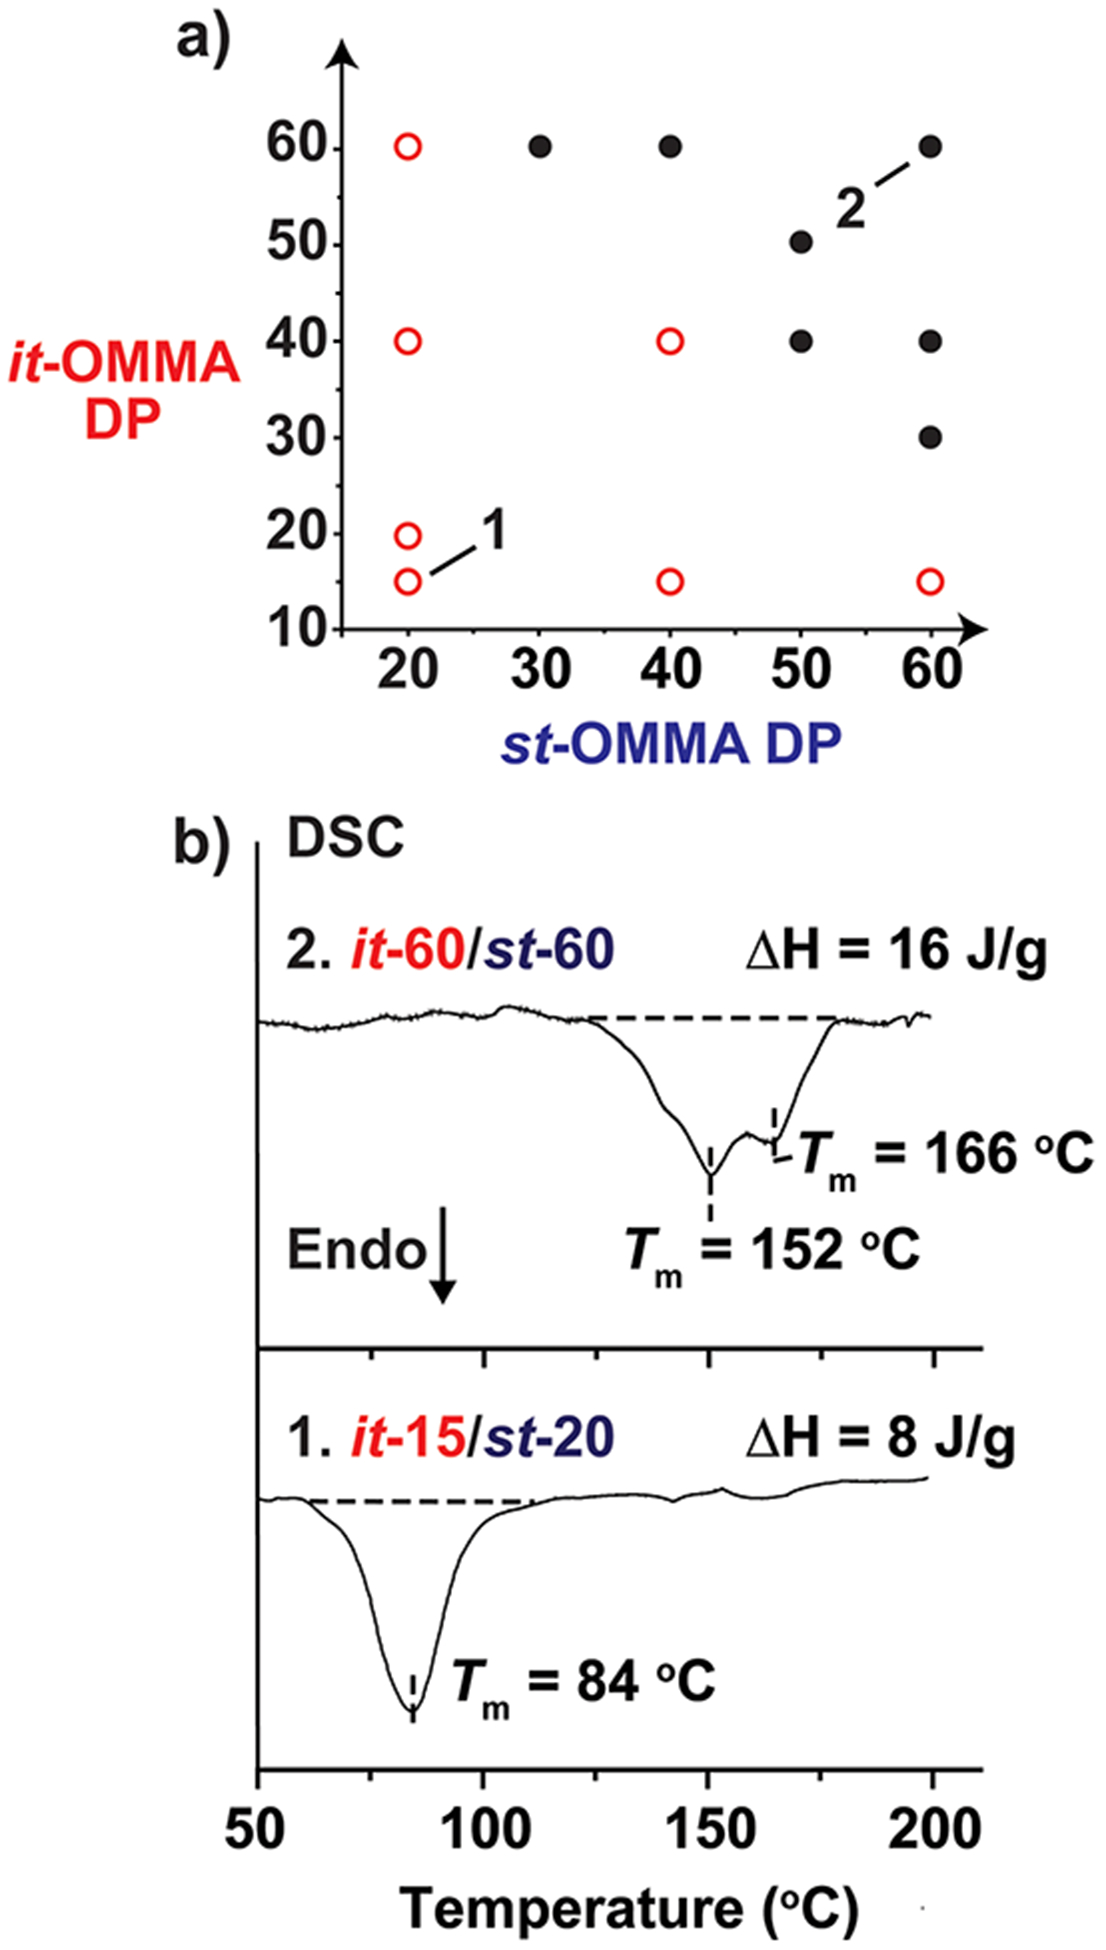
(a) Diagram illustrating the melting behavior of OMMA stereocomplexes as a function of it-/st-OMMA chain lengths. Open (○) and closed (●) circles refer to samples with one and two melting peaks, respectively. (b) Differential scanning calorimetry (DSC) profiles of two illustrative stereocomplex examples (i.e., it-60/st-60 and it-15/st-20) showing melting transitions with two peaks and a single peak, respectively.