
Figure 1. Analysis of F121-9 NAD sequencing data and comparison with heterochromatin.
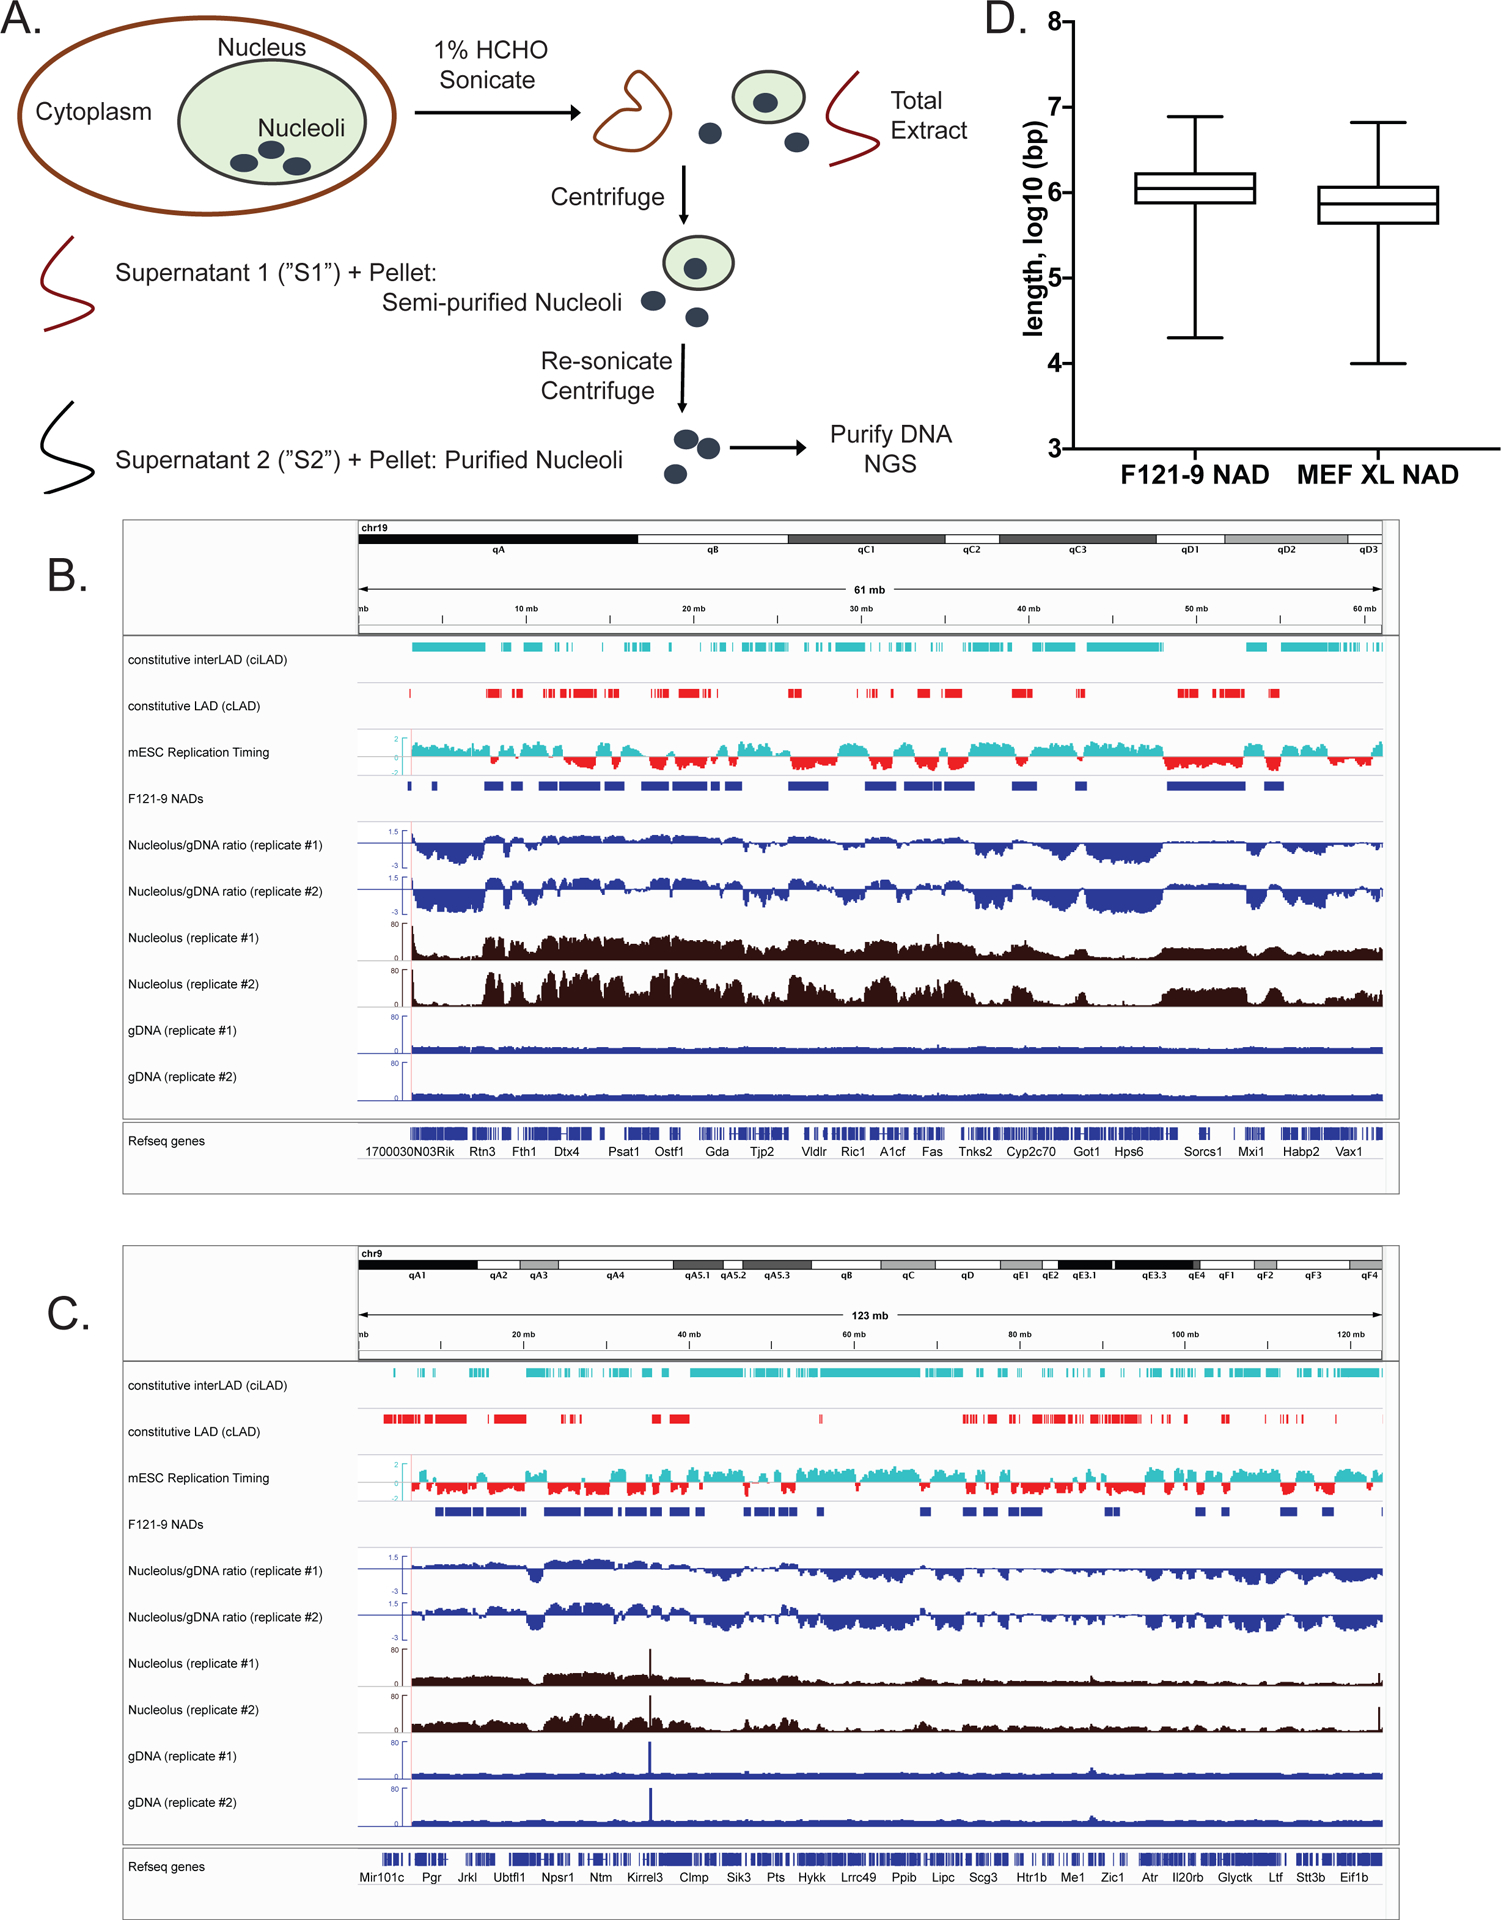
A. Schematic diagram of nucleoli isolation from crosslinked cells.
B. All of chromosome 19 is shown, which contains strongly nucleoli-associated regions. From the top, tracks shown are: Constitutive interLADs (ciLADs, cyan) and Constitutive LADs (cLADs, red) (Peric-Hupkes et al. 2010); mESC replication timing (Hiratani et al. 2010, early replicating regions in cyan and late replicating regions in red); F121-9 cell NAD peaks (“F121-9 NADs”, called using NADfinder software based on two replicate experiments); Nucleolar/gDNA ratios, shown for both replicate experiments; raw read counts from both replicates for nucleoli-associated DNA (“Nucleolus”, brown) and total genomic DNA (“gDNA”, dark blue).
C. As in panel A, with all of chromosome 9 shown.
D. Length distribution of F121-9 NADs, compared to those from crosslinked MEF cells (Vertii et al. 2019).