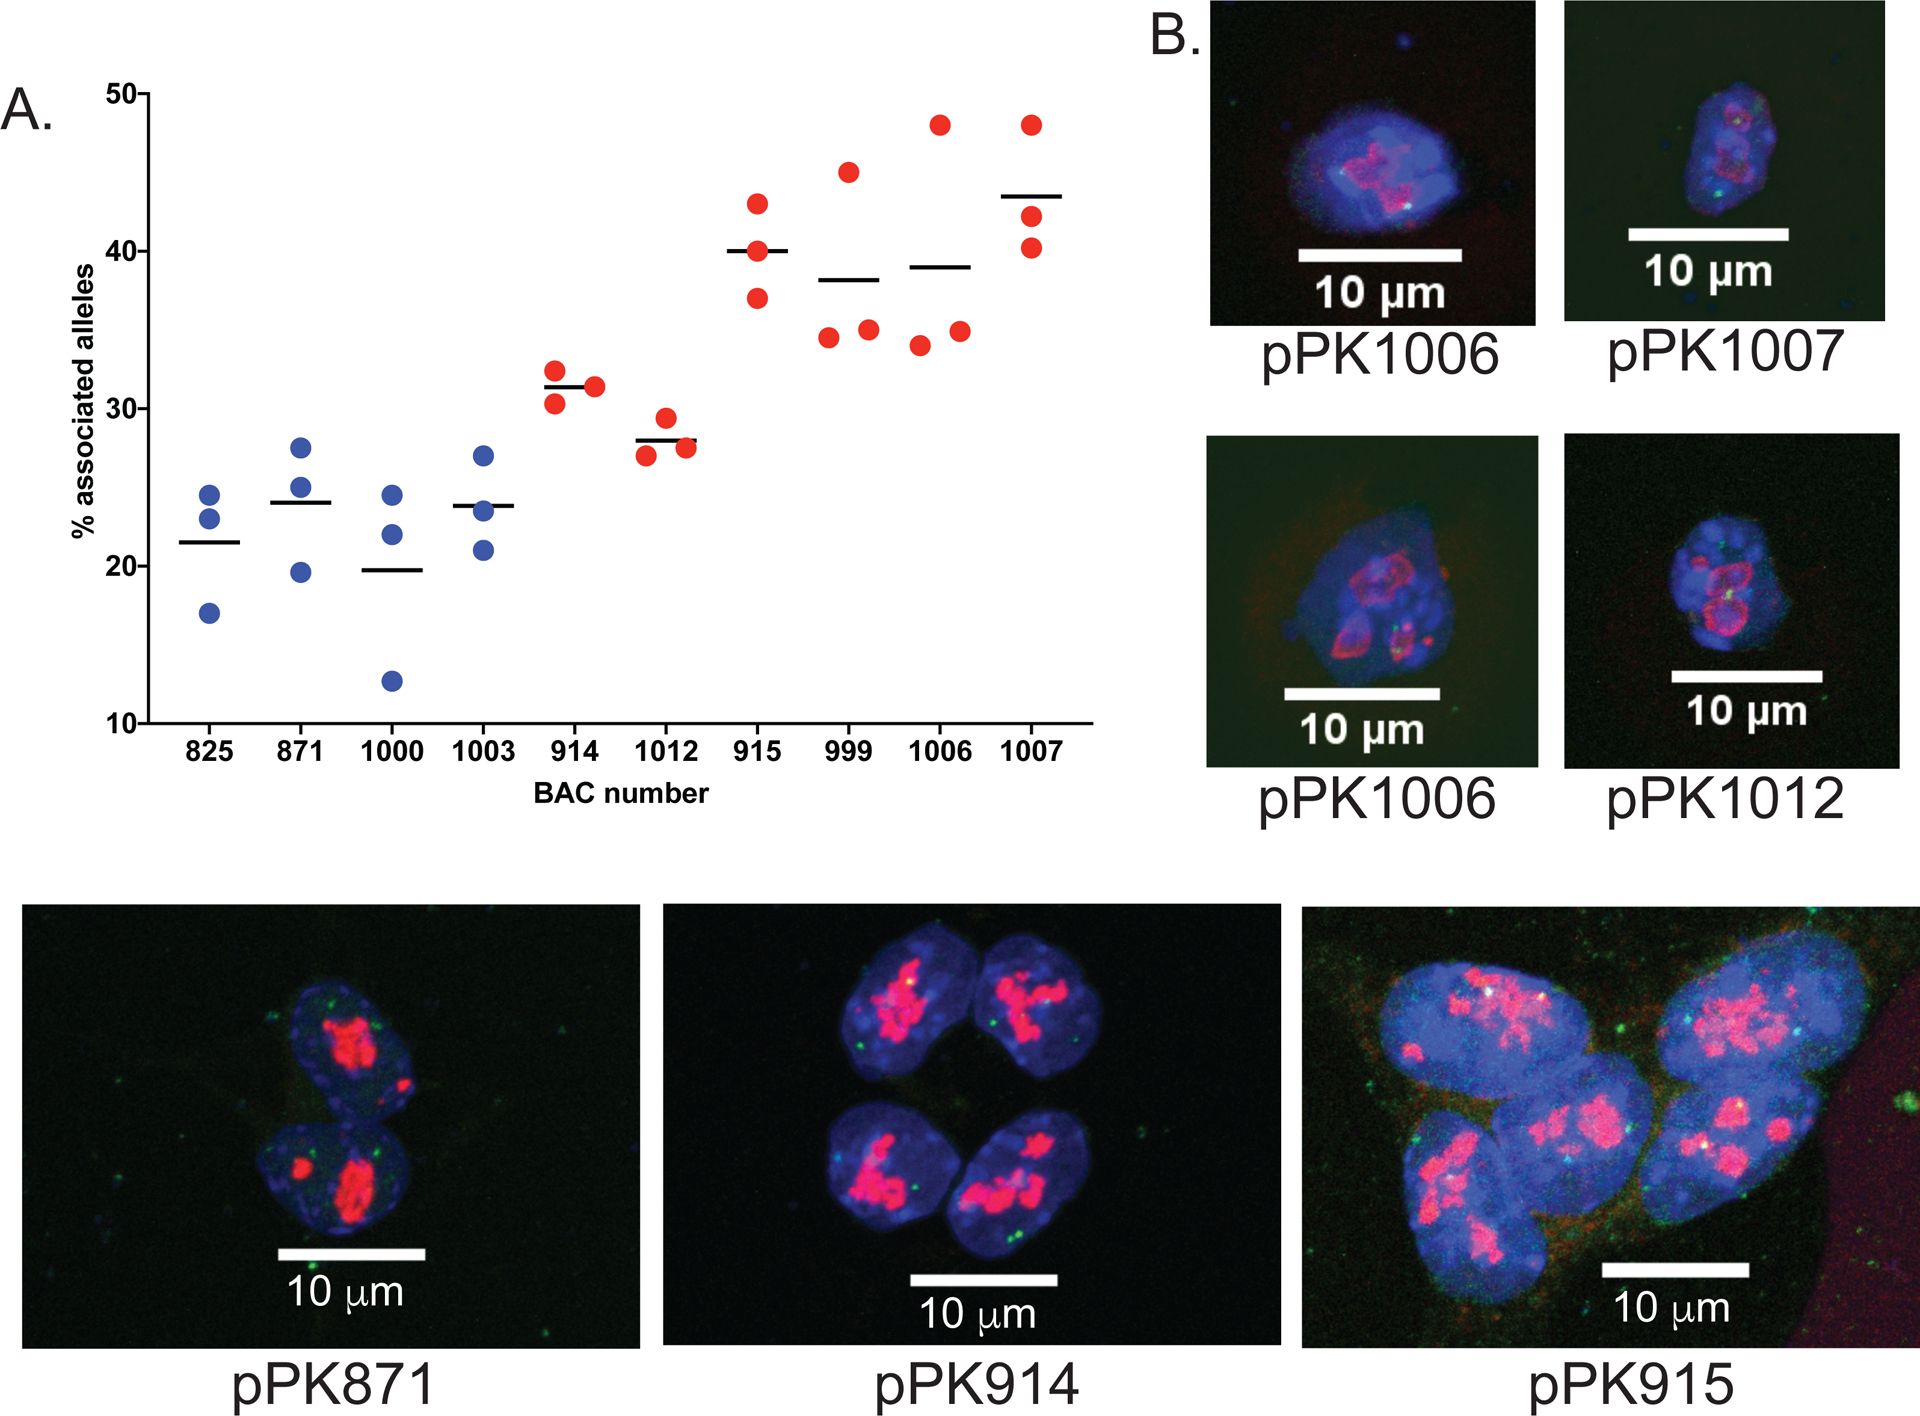
Figure 3. 3D DNA-FISH experiments validate nucleolar association of NADs in F121-9 mESC.

A. Graph of percentage of alleles that are nucleolar-associated (individual values and means are graphed for three biological replicates) for the indicated BAC probes (see Supplemental Table 2). The six probes on the left (red points) all displayed significantly more frequent associations that the non-NAD probes (blue points; p < 0.0001 for each red probe).
B. Maximum projection images from 3D immuno-FISH experiments with nuclear DAPI staining in blue, anti-fibrillarin (pPK871, pPK914 and pPK915, lower panels) or anti-nucleophosmin (pPK1006, pPK1007 and pPK1012, upper panels) antibody staining in red, and DNA probes in green. 63x magnification, scale bar 10 μm.
