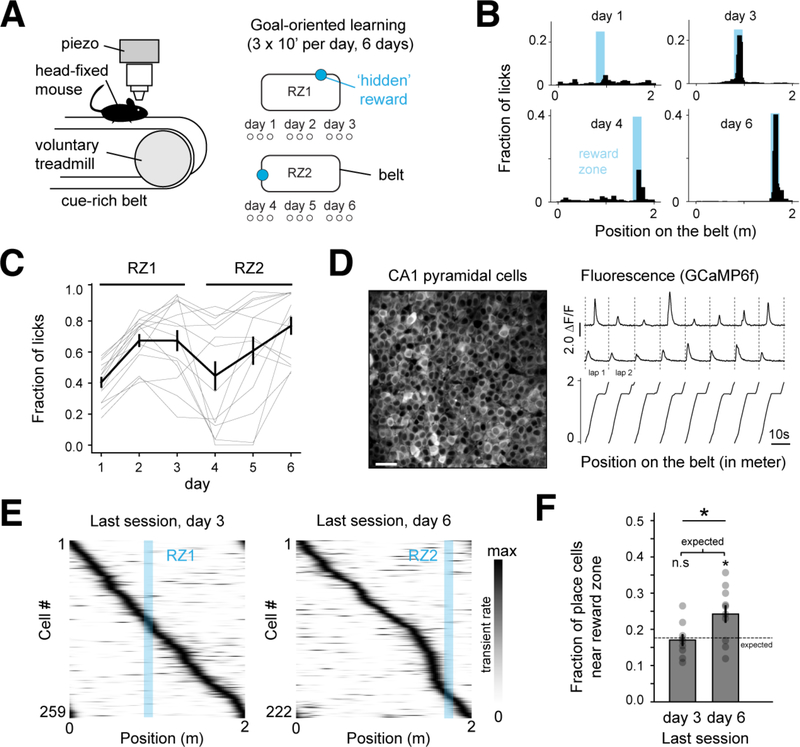
Figure 1. Place cells are enriched at a translocated reward site during GOL.
A. The goal-oriented learning (GOL) task. Mice searched for an unmarked reward zone (RZ), and water rewards were delivered operantly within the fixed 10cm zone. The RZ was at the same location for 3 days, and then moved to a new location.
B. Representative licking from one mouse. Histograms: fraction of total number of licks in each position bin (n=100). Blue shaded areas: RZs.
C. Fraction of licks within the RZ aggregated by session and plotted by day (thick line and bars: mean±SEM, thin gray lines: individual animals).
D. Left: time-averaged image from a representative recording session with 2p GCaMP6f imaging in CA1PCs. Right: relative GCaMP-calcium fluorescence (ΔF/F) traces from two example place cells. Scale bar: 50 μm.
E. Example place cell tuning curves in the last session of RZ1 and RZ2. Rows: average tuning curves for individual cells along the linearized belt, normalized by peak activity. Blue shaded area: RZ location.
F. Percentage of place cells (mean±SEM) in the peri-reward zone (pRZ) defined as the RZ +25 cm preceding the zone. The last session of day6 (RZ2) shows enrichment compared with day3 (RZ1). Dashed line: percentage of place cells expected from a uniform distribution along the belt (day3: 0.17±0.045, day6: 0.242±0.07, unpaired two-tailed t-test; t(18)=−2.4, p=0.02. One-sample two-tailed t-test for expected value derived from the uniform distribution; day3: t(8)=−0.36, p=0.72, day 6: t(9)= 2.72, p=0.02).
See also Figures S2–4.

