
Figure 7. Glutathione restricts de novo serine synthesis and enhances anti-tumor immune responses.
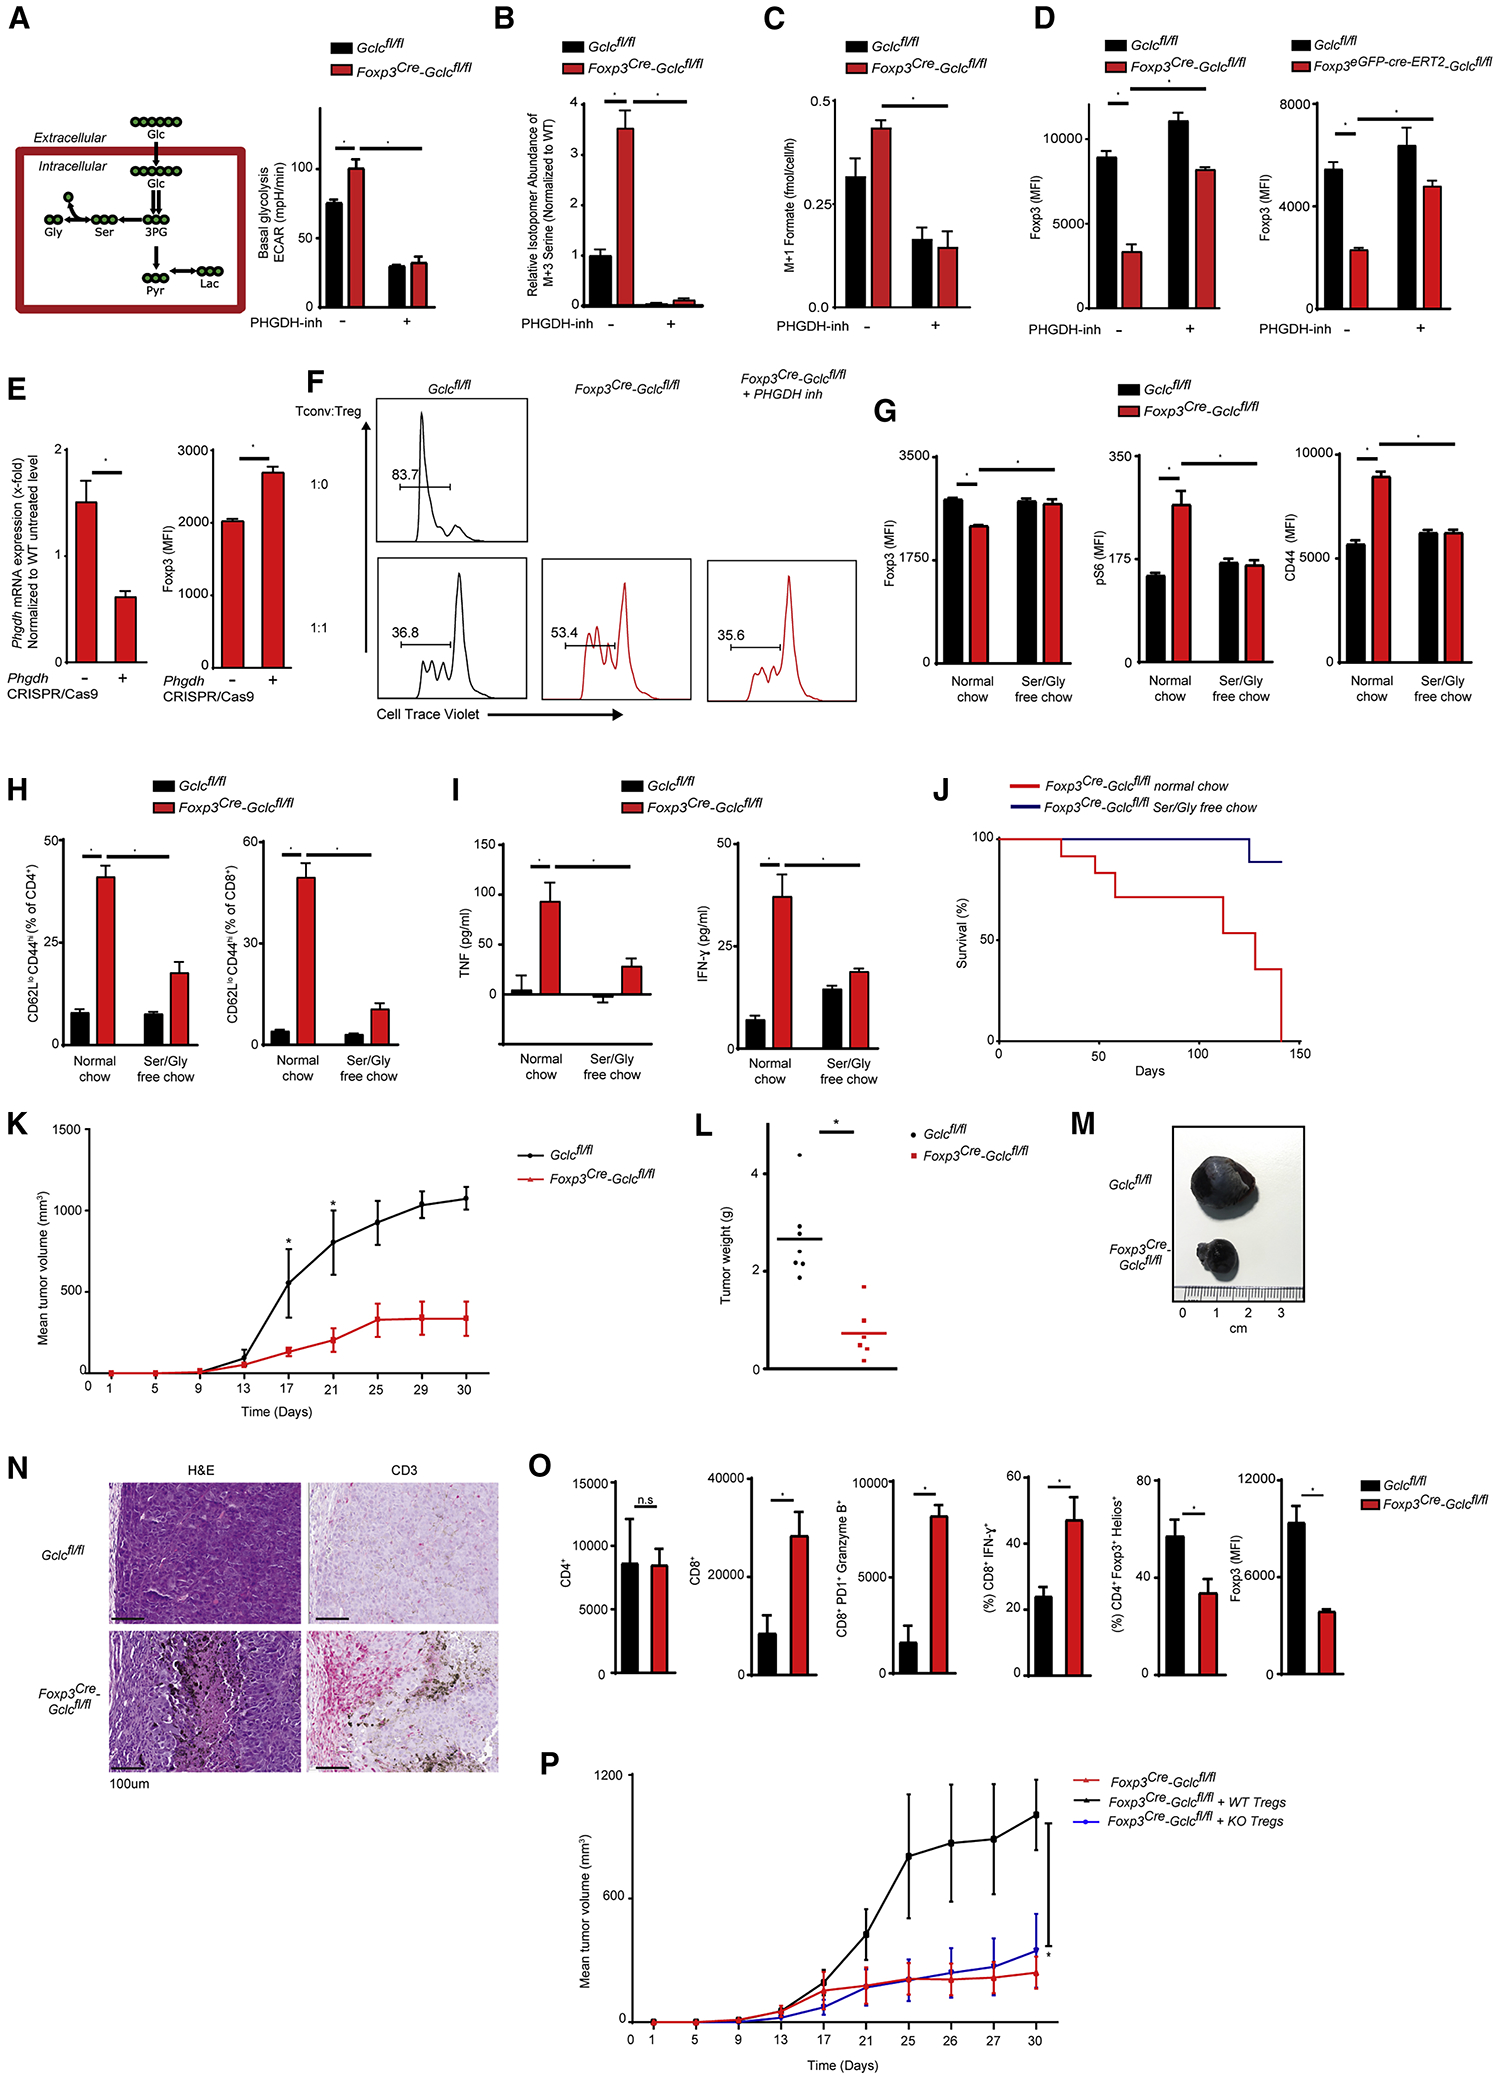
(A) Diagram of serine synthesis pathway (left), and quantification of ECAR of Gclcfl/fl and Foxp3cre-Gclcfl/fl iTregs cultured with/without 10 μM PHGDH inhibitor (right). Data are mean±SEM (n=3); 2 trials. (B) Mass isotopomer distribution of M+3 serine in the cells in (A) following incubation with [U-13C6]-glucose for 24hr. (C) Mass isotopomer distribution of M+1 formate in the cells in (A) following incubation with [U-13C6]-glucose for 24hr. (D) Intracellular staining and FCA of FoxP3 in Gclcfl/fl vs Foxp3cre-Gclcfl/fl (left) and Gclcfl/fl vs Foxp3eGPF-cre-ERT2-Gclcfl/fl (right) iTregs treated with/without PHGDH inhibitor. Gclcfl/fl vs Foxp3eGPF-cre-ERT2-Gclcfl/fl iTregs were co-incubated with 4-OHT. Data are mean±SEM (n=3); 3 trials. (E) Phgdh mRNA expression (left) and intracellular staining and FCA of FoxP3 (right) in Gclcfl/fl vs Foxp3cre-Gclcfl/fl iTregs that were nucelofected with sgRNAs specific for Phgdh or controls. Data are mean±SEM (n=3); 2 trials. (F) In vitro suppression assay of Gclcfl/fl vs Foxp3cre-Gclcfl/fl iTregs treated with PHGDH inhibitor prior to incubation with CTV-labeled Tconv at the indicated ratios; 3 trials. (G) Intracellular staining and FCA of FoxP3, pS6 and CD44 in splenic Tregs of Gclcfl/fl vs Foxp3cre-Gclcfl/fl mice (12wk) fed with normal chow or a serine/glycine-deficient diet for 9wk. Data are mean±SEM (n=4–11); 2 trials. (H) FCA and quantification of Teff (CD44hiCD62Llo) within CD4+ (left) and CD8+ (right) T cell populations in blood of the mice in (G). Data are mean±SEM (n=4–11); 2 trials. (I) ELISA of IFNγ and TNF in serum of the mice in (G). Data are mean±SEM (n=4–11); 2 trials. (J) Survival of Foxp3cre-Gclcfl/fl mice on normal chow (n=12) or a serine/glycine-deficient diet (n=9); (K-N) Gclcfl/fl and Foxp3cre-Gclcfl/fl mice (8wk) were transplanted s.c. with B16F10 melanoma cells. (K) Mean tumor volumes determined at the indicated times. (L) Quantification of tumor weights at time of sacrifice. Each dot = individual mouse. (M) Representative macroscopic images of tumors from transplanted Gclcfl/fl and Foxp3cre-Gclcfl/fl mice. (N) Histology of tumor sections from the mice in (F) stained with H&E or αCD3. Scale bars, 100 μm. Results are representative of 4 mice/group; 2 trials. (O) Quantification of the indicated TIL subsets in tumors of Gclcfl/fl and Foxp3cre-Gclcfl/fl mice treated as in (K). Data are mean±SEM (n=5); (P) Mean tumor volumes at the indicated times in Foxp3cre-Gclcfl/fl mice (8wk) transplanted s.c. with B16F10 melanoma cells and injected intravenously with nTregs from Gclcfl/fl (WT) or Foxp3cre-Gclcfl/fl (KO) mice at day 0. Data are mean±SEM (n=4) 2 trials. *p<0.05.