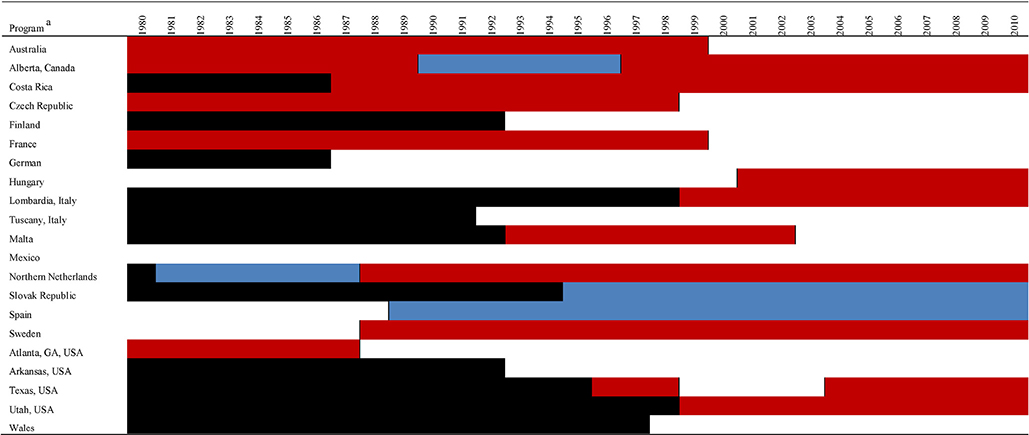
Table 3 –
Annual trends in the total prevalence of hypospadias by program, 1980–2010
 |
Key: red boxes represent years with a significantly increasing trend in total prevalence of hypospadias (p < 0.05); blue boxes, years with a significantly decreasing trend (p < 0.05); white boxes, years with no significant trend (p ≥ 0.0.5); and black boxes, years with no observations.
Joinpoint regression was not performed for programs with <11 yr of data (Argentina, Colombia, Chile, Canada [National], and Iran) or any years of missing data during the period analyzed (New Zealand) due to the software’s minimum data requirements.
