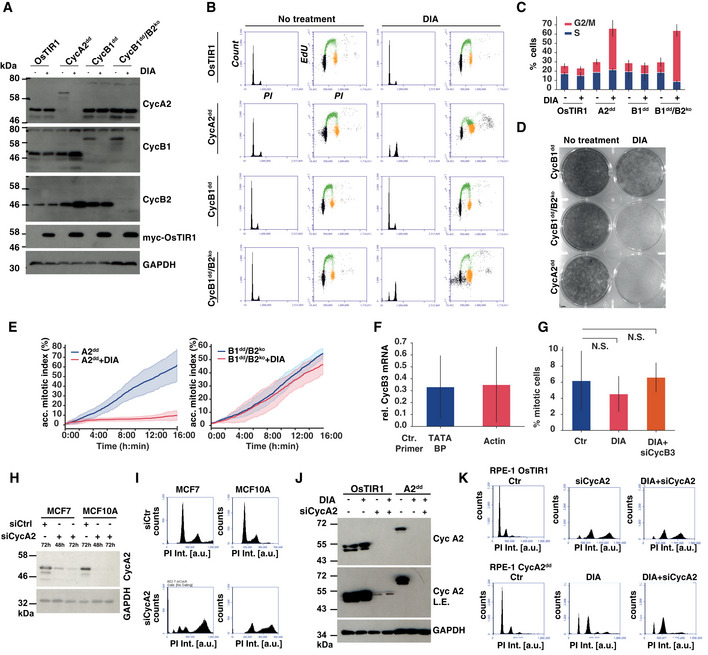
Cyclin B2 knock‐out and induced degradation by immunoblotting. Indicated cell lines were analysed 24 h after mock or Dox/IAA/Asv (DIA) treatment using the indicated antibodies to confirm homozygous gene tagging and efficiency of protein degradation.
Cell cycle analysis 24 h after DIA treatment. Cells were analysed by EdU labelling, PI staining and FACS analysis. The histograms show the PI intensities while the dot plots show EdU incorporation (y‐axis) vs PI intensity (x‐axis). Gating of cell cycle phases is indicated by colour (G1—black, S phase—green, G2/M phase—orange)
Cell cycle phase frequencies quantified from flow cytometry data (shown in (B)) in indicated cell lines 24 h after DIA treatment, (n = 3 experiments, s.d. indicated by error bars).
Cell proliferation of A2dd, CycB1dd and B1dd/B2ko following mock or DIA treatment. One thousand cells were plated in each well (diameter 3.5 cm) and incubated for 10 days before methanol fixation and Crystal Violet staining.
Kinetics of mitotic entry as measured by time‐lapse microscopy in A2dd and B1dd/B2ko cells following mock or 4‐h DIA treatment of asynchronous cells. The cells were imaged for 16 h with 5‐min intervals using widefield DIC; mitotic entry was manually scored by detecting cell rounding. Curves display the cumulative mitotic index (data from three repeats, n > 500 cells per condition, s.d. indicated by shaded area).
qPCR analysis of cyclin B3 mRNA levels, following 72‐h depletion in B1dd/B2ko cells. For quantification, we used primers to amplify two control mRNAs, TATA‐binding protein and actin. The plot shows the levels of CycB3 siRNA‐depleted mRNA relative to Ctr siRNA‐transfected cells. (Bars indicate the mean of three independent experiments; error bars indicate the standard deviation between these three repeats.)
Mitotic index measurements of B1dd/B2ko cells with the indicated treatments. Cells were transfected with siRNA for 72 h; after 36 h, they were blocked for 24 h with Thymidine and fixed 12 h after release from Thymidine. ProTAME and Apcin were added for the final 2 h before fixation. Mitotic cells were scored based on DAPI staining and on condensed chromosome formation. The bar plots show mean values of three biological repeats (n = 100 per repeat and sample, error bars indicate standard deviation, and P‐values were calculated using an independent two‐sample t‐test).
Cyclin A2 siRNA depletion in MCF7 and MCF10A cells. The cells were transfected with Ctr or cyclin A2 siRNA for indicated length of time and probed for cyclin A2 levels by immunoblotting.
Cyclin A2 siRNA depletion causes endoreplication. Following 72 h of siRNA transfection, MCF7 and MCF10A cells were analysed by PI staining and FACS. The histograms show the changes in DNA content (PI Int.) towards > 4N following cyclin A2 depletion.
Cyclin A2 siRNA and degron depletion in RPE‐1 cells. RPE‐1 OsTIR1 and RPE‐1 A2dd cells were subjected to 72 h of cyclin A2 siRNA depletion and/or of DIA treatment as indicated and probed for cyclin A2 levels by immunoblotting. The longer exposure (L.E.) reveals incomplete depletion of cyclin 2 by siRNA.
Cyclin A degron depletion causes accumulation of cells in G2 phase. Following 72 h of siRNA transfection or DIA treatment, RPE‐1 OsTIR1 and A2dd cells were analysed by PI staining and FACS. The histograms show the changes in DNA content (PI Int.) towards > 4N following cyclin siRNA A2 depletion in RPE‐1 OsTIR1 cells, while DIA treatment in A2dd cells does cause an increase in the 4N but not > 4N peak.