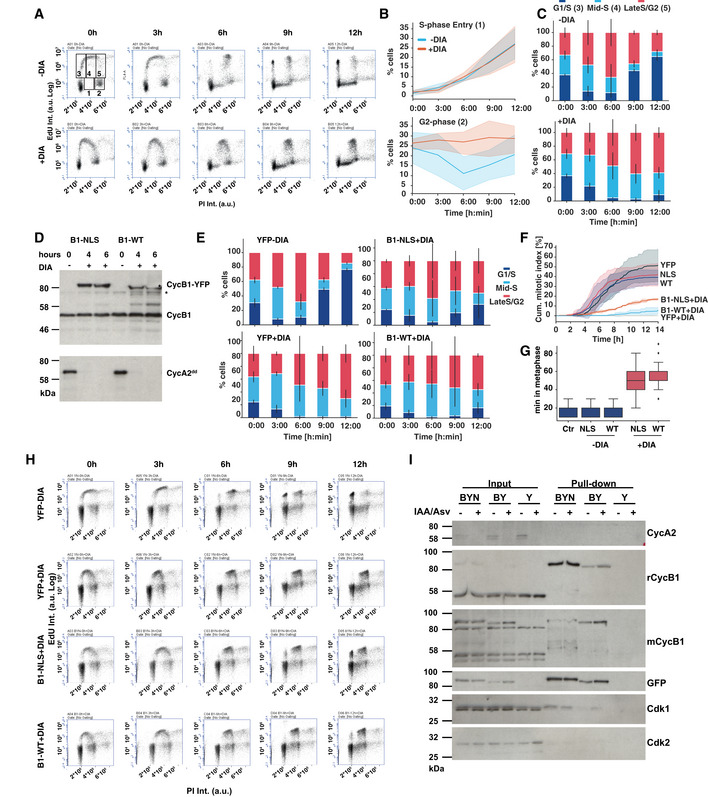
FACS plots from EdU pulse‐chase experiment. Cells were DIA‐ or mock‐treated for 4 h and then labelled with EdU for 1 h. The EdU was then washed out and samples were taken every 3 h for 12 h and analysed by EdU/PI staining and FACS. The top left panel shows the gates that were used for analysis. The quantifications shown in the panels to the right are from three independent repeats of this experiment.
Quantification of cells progressing into Gate 1 (top panel, new S‐phase cells) and Gate 2 (bottom panel, G2 cells) over time. The lines represent the mean of three experiments; the coloured areas indicate the standard deviation.
Relative changes in the percentage of EdU‐positive cells in gates 3, 4 and 5 (G1/early S, mid‐S and late S/G2 phase). The bars indicate the relative mean values from three independent experiments; the error bars represent the standard deviation.
Cyclin A2dd cells with inducible CycB1‐YFP (B1‐WT) and CycB1‐YFP‐NLS (B1‐NLS) were analysed for DIA‐induced cyclin B1 expression/cyclin A2 depletion. Samples were collected at indicated time points and probed by immunoblotting with cyclin B1 and cyclin A2 antibodies (* indicates non‐specific band).
Quantifications of EdU pulse‐chase data as in (C) in DIA‐treated cyclin A2 cells expressing B1‐WT, B1‐NLS or YFP as indicated. The bars indicate the relative mean values from three independent experiments; the error bars represent the standard deviation.
Accumulative mitotic index measurement of cyclin A2 cells following cyclin A2 depletions and induction of indicated cDNAs. The lines represent the mean of three experiments; the coloured areas indicate the standard deviation.
Quantification of metaphase duration in A2dd cells treated with DIA following induction of indicated proteins (n > 50 per repeat, the boxplot indicates median, first and third quartile and minimum/maximum values).
FACS plots from EdU pulse‐chase experiment in A2dd cells following induction of indicated genes. Data are representative example for quantifications shown in (E).
Immunoprecipitation of YFP from extract from A2dd following induction of YFP (Y), CycB1‐YFP (BY) and CycB1‐YFP‐NLS (BYN). The samples in the odd lanes (IAA/Asv−) were treated with 1 μg/ml doxycycline alone, while samples in even lanes (IAA/Asv+) were treated with Auxin and Asv to induce cyclin A2 depletion. Total cell extract and immune precipitates were probed by immunoblotting with the indicated antisera.