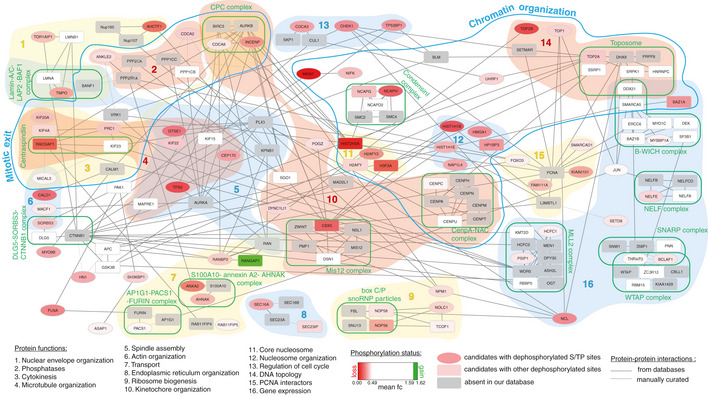
Figure EV5. Network analysis of identified cyclin B substrates.

Candidates with increased phosphorylation following cyclin B depletion are shown in green and candidates with decreased phosphorylation in red. Grey signifies proteins that are in a known complex, but absent from our data. S/TP sites are shown as ellipses.
