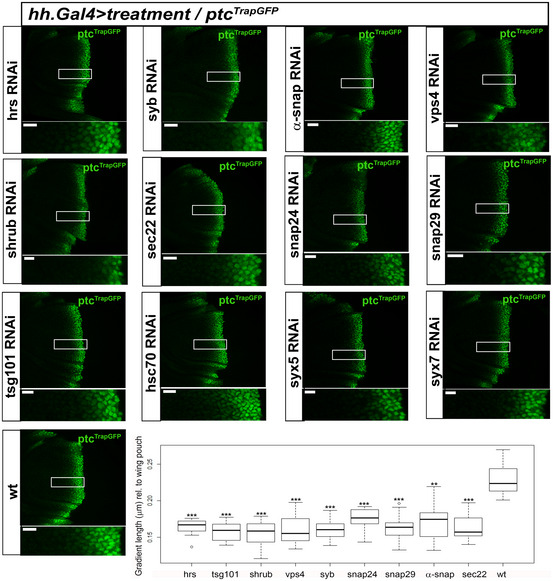
Confocal lateral images of wing discs carrying a Trap‐GFP insertion within Ptc regulatory sequences, as a fluorescent reporter of Hh signalling activity. Each image shows effects over Hh signalling of several RNAi expressions for ESCRT and SNARE complexes components in Hh‐producing cells. Right bottom panel is a box plot showing quantification of the signal extension (μm) normalized in relation to the wing pouch size; central horizontal lines show median values of
N = 9–14 (see
Appendix Table S2), boxes show lower and upper quartiles, and whiskers show the maximum and minimum excluding outliers. Note that all treatments significantly reduce signal extension. Significance levels for pairwise test (Wilcoxon) ***
P < 0.001, **
P < 0.01, *
P < 0.05.