-
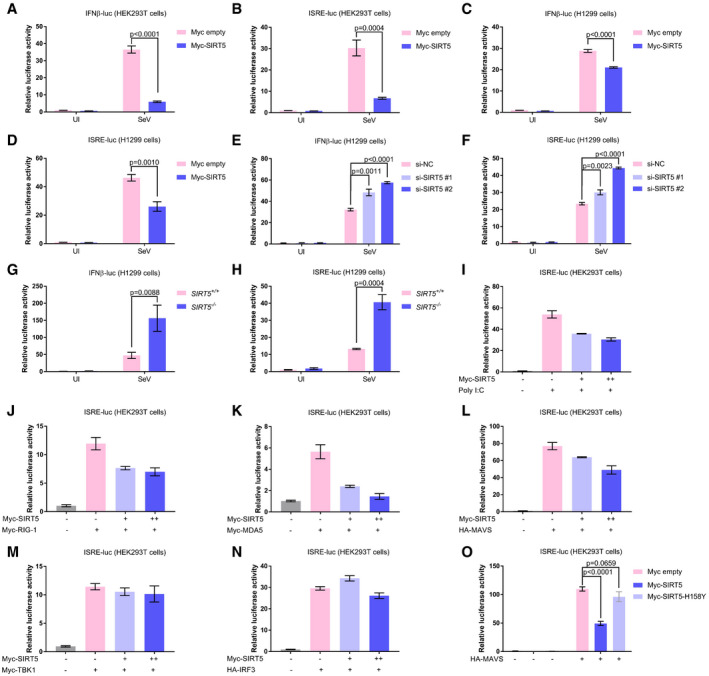
A, B
IFNβ promoter activity (A) and ISRE reporter activity (B) in Myc empty vector (200 ng) or Myc‐SIRT5 (200 ng)‐transfected HEK293T cells with or without SeV infection (SeV or UI) for 18–24 h.
-
C, D
IFNβ promoter activity (C) and ISRE reporter activity (D) in Myc empty vector (200 ng) or Myc‐SIRT5 (200 ng)‐transfected H1299 cells with or without SeV infection (SeV or UI) for 18–24 h.
-
E, F
IFNβ promoter activity (E) and ISRE reporter activity (F) in the indicated siRNA‐transfected H1299 cells (si‐NC, si‐SIRT5#1, and si‐SIRT5#2) with or without SeV infection (SeV or UI) for 18–24 h. NC, negative control.
-
G, H
IFNβ promoter activity (G) and ISRE reporter activity (H) in SIRT5‐deficient H1299 cells (SIRT5−/−) or the wild‐type (WT) H1299 cells (SIRT5
+/+) with or without SeV infection (SeV or UI) for 18–24 h.
-
I
ISRE reporter activity in Myc‐SIRT5 (0, 100, or 200 ng)‐transfected HEK293T cells with or without poly(I:C) transfection for 18–24 h.
-
J
ISRE reporter activity in co‐transfection of Myc‐RIG‐I (200 ng) together with Myc‐SIRT5 (0, 100, or 200 ng)‐transfected HEK293T cells for 24 h.
-
K
ISRE reporter activity in co‐transfection of Myc‐MDA5 (200 ng) together with Myc‐SIRT5 (0, 100, or 200 ng) in HEK293T cells for 24 h.
-
L
ISRE reporter activity in co‐transfection of HA‐MAVS (200 ng) together with Myc‐SIRT5 (0, 100, or 200 ng) in HEK293T cells for 24 h.
-
M
ISRE reporter activity in co‐transfection of Myc‐TBK1 (200 ng) together with Myc‐SIRT5 (0, 100, or 200 ng) in HEK293T cells for 24 h.
-
N
ISRE reporter activity in co‐transfection of HA‐IRF3 (200 ng) together with Myc‐SIRT5 (0, 100, or 200 ng) in HEK293T cells for 24 h.
-
O
ISRE reporter activity in co‐transfection of HA‐MAVS (200 ng) together with Myc‐SIRT5 (200 ng) or Myc‐SIRT5‐H158Y (200 ng), respectively, in HEK293T cells for 24 h.
Data information: Graphs represent fold induction relative to the luciferase activity in the control cells. UI, uninfected. All data are presented as the mean values based on three independent experiments, and error bars indicate s.e.m. (unpaired two‐tailed Student's
‐test).

