-
A, B
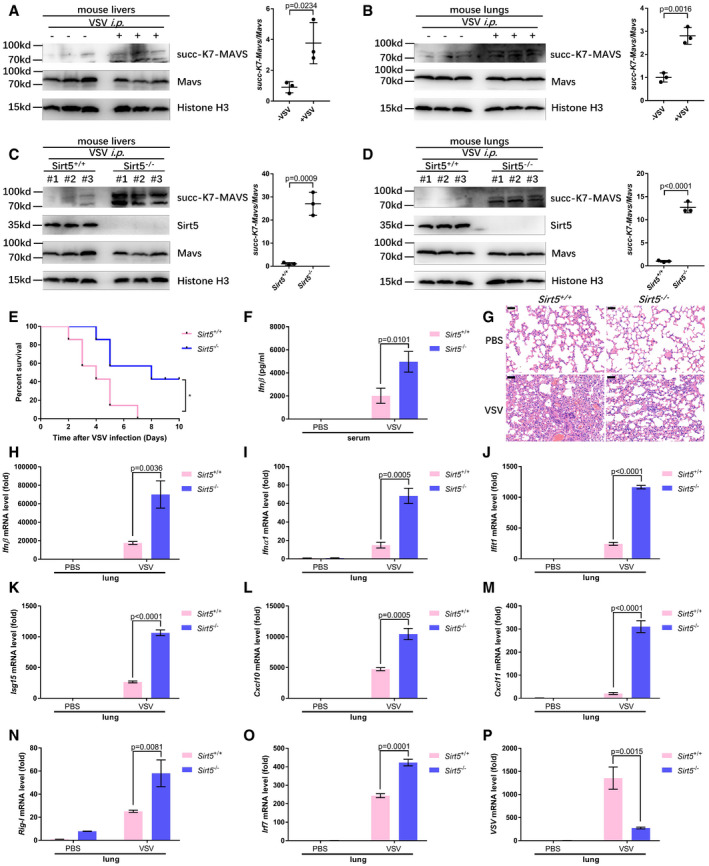
VSV infection increased MAVS succinylation in mouse livers (A) and lungs (B). Proteins in the livers (A) and lungs (B) of WT littermates injected intraperitoneally with (+) VSV (1 × 10⁷ plaque‐forming units (PFU) per mouse) or PBS control (−) (n = 3 per group) were detected with the indicated antibodies. MAVS succinylation was determined by anti‐succ‐K7‐MAVS antibody. Relative succinylation level was quantified (right panel).
-
C, D
Knockout of Sirt5 increased MAVS succinylation in mouse livers (C) and lungs (D) upon VSV infection. Proteins in the livers (C) and lungs (D) of Sirt5‐deficient or WT littermates (Sirt5
−/− or Sirt5
+/+) injected intraperitoneally with VSV (1 × 10⁷ plaque‐forming units (PFU) per mouse) (n = 3 per group) for 24 h were detected with the indicated antibodies. MAVS succinylation was determined by anti‐succ‐K7‐MAVS antibody. Relative succinylation level was quantified (right panel).
-
E
Survival (Kaplan–Meier curve) of WT mice (n = 7) and Sirt5‐deficient mice (n = 7) injected intraperitoneally with a high dose of VSV (5 × 10⁷ PFU per mouse) and monitored for 10 days.
-
F
ELISA assay of Ifnβ in serum from the WT mice (n = 4) and Sirt5‐deficient mice (n = 4) injected intraperitoneally with VSV (1 × 10⁷ plaque‐forming units (PFU) per mouse) or PBS control for 24 h.
-
G
Hematoxylin‐and‐eosin‐stained images of lung sections from mice in F. Scale bar = 50 μm.
-
H–O
qPCR analysis of Ifnβ (H), Ifnα1 (I), Ifit1 (J), Isg15 (K), Cxcl10 (L), Cxcl11 (M), Rig‐I (N), and Irf7 (O) mRNA in the lungs of WT or Sirt5‐deficient mice (Sirt5
+/+ or Sirt5
−/−) injected intraperitoneally with VSV (1 × 10⁷ plaque‐forming units (PFU) per mouse) or PBS control for 24 h.
-
P
qPCR analysis of VSV mRNA in the lungs of WT or Sirt5‐deficient mice (Sirt5
+/+ or Sirt5
−/−) injected intraperitoneally with VSV (1 × 10⁷ plaque‐forming units (PFU) per mouse) or PBS control for 24 h.
Data information: The graphs represent fold induction relative to the untreated WT mice. PBS, phosphate‐buffered saline. All data are presented as the mean values based on three independent experiments, and error bars indicate s.e.m. (unpaired two‐tailed Student's
‐test or two‐way ANOVA analysis).

