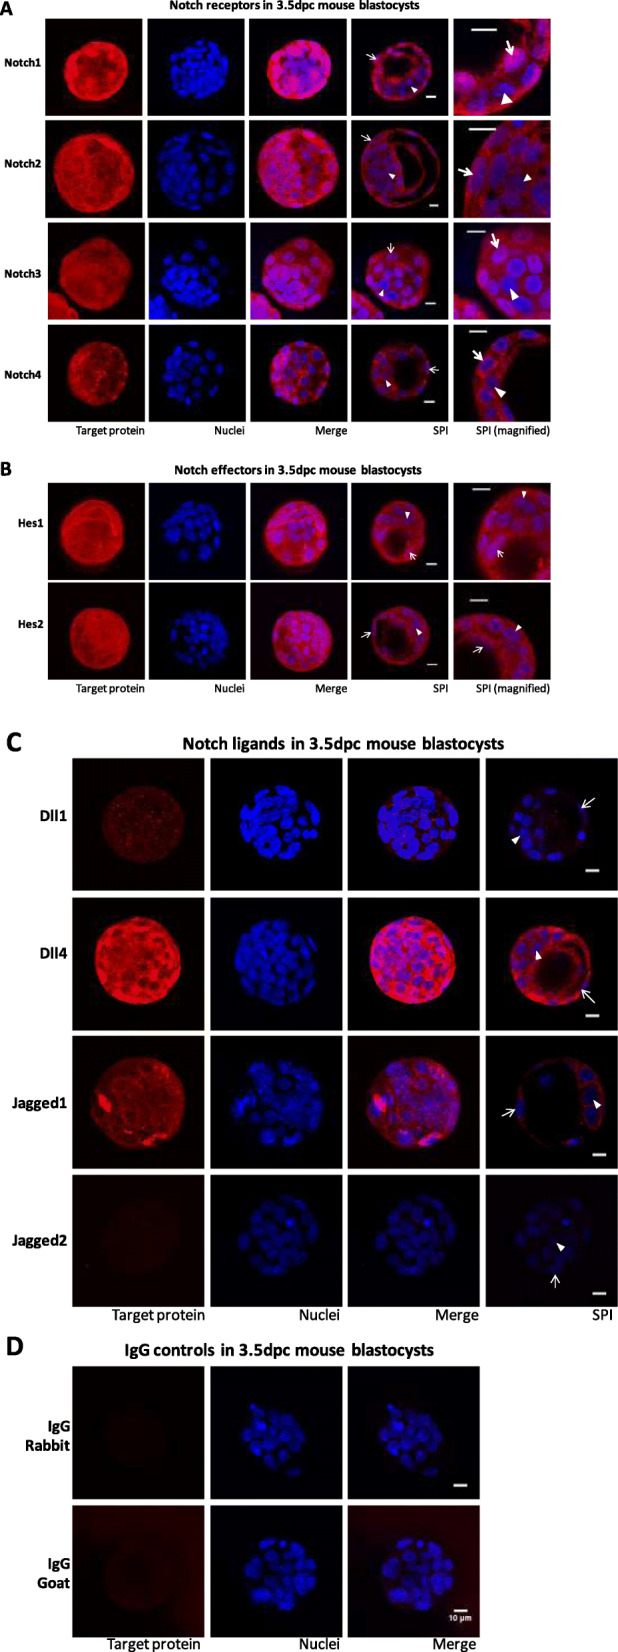
Fig. 4.

Expression of Notch receptors Notch1–4 (a), Notch effectors Hes1–2 (b), Notch ligands Delta-like1 and 4 and Jagged1–2 (c), and negative controls (Rabbit and Goat IgG; d) in 3.5 dpc blastocysts. Confocal photomicrographs show representative images of each target protein immunostaining. Images were selected to show the similar staining pattern of six blastocysts, for each protein. Target proteins are stained red and nuclei are stained blue with Hoechst. Images in the first three columns are maximum intensity projections of the obtained Z-stack; the fourth and fifth columns are representative single plane images (SPI). Examples of presumptive trophectoderm cells’ nuclei are marked with arrows (→) and examples of presumptive inner cell mass cells’ nuclei are marked with arrowheads (►). Scale bar 10 μm. Notice that there is no detectable staining for Dll1 and Jagged2 proteins, which show a similar staining to that of negative controls
