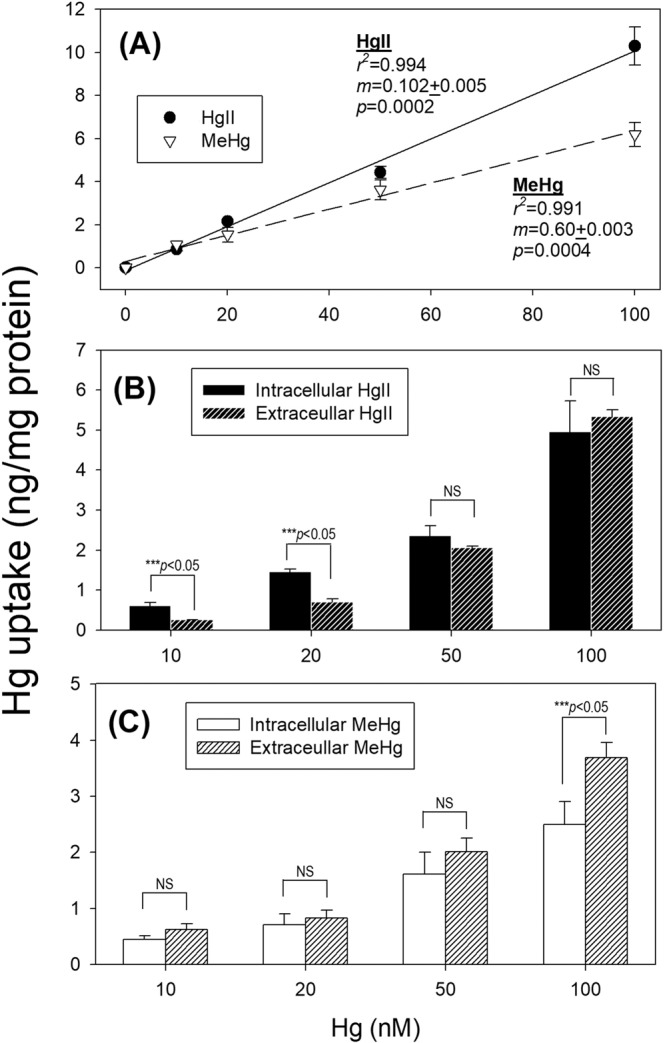
Figure 3.

Uptake experiments on EA.hy926 endothelial cells upon exposure to different sublethal concentrations of HgII and MeHg (A) relationship between total HgII or MeHg uptake in cells and exposure concentrations after 24 h, (B) intracellular and extracellular HgII in cells, and statistical comparison between these two pools of HgII, (NS = not significant, p > 0.05), and (C) intracellular and extracellular MeHg in cells, and statistical comparison between these two pools of HgII, (NS = not significant, p > 0.05). Data are mean ± SD (n = 3).
