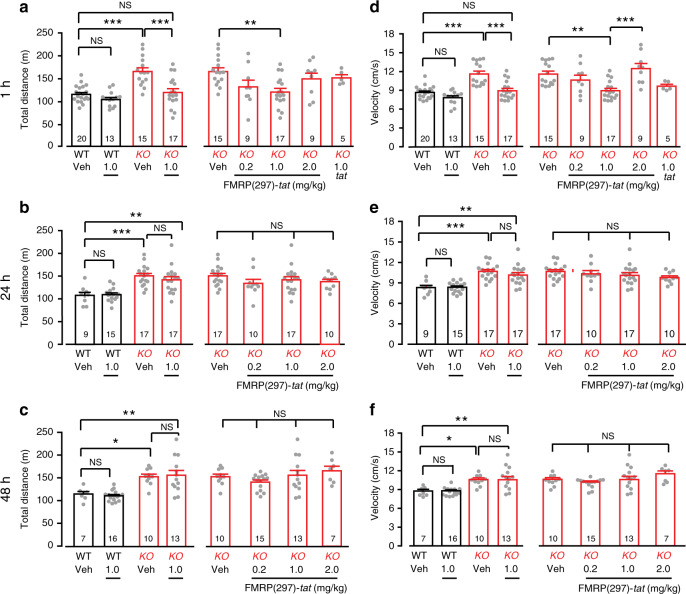
Fig. 8. FMRP(1–297)-tat reduces elevated levels of activity in Fmr1 KO mice.
Shown are mean bar-dot plots for total distance (a–c) and mean velocity (d–f) in P55–100 WT and Fmr1 KO mice over 30 min in an open field test (OFT) at 1, 24, and 48 h following tail vein injection of vehicle, different concentrations of FMRP(1–297)-tat, or tat epitope alone. Fmr1 KO mice exhibit higher levels of activity compared to WT animals in terms of total distance traveled in the field that is significantly reduced at 1 h by 1.0 mg/kg FMRP (1-297)-tat tail vein injection (a left panel: two-way ANOVA analysis of the interaction between genotype and treatment F(1,61),interaction = 6.792, p = 0.012; post hoc Tukey’s test: p(KO veh,WT veh) < 0.0001, p(KO veh,KO 1.0) < 0.0001; a right panel: one-way ANOVA F(4,54) = 3.817, p = 0.00875; post-hoc Tukey’s test: p(KO veh,KO 1.0) = 0.00475), as well as the velocity of movement (d, left panel: Two-way ANOVA F(1,61),interaction = 7.035, p = 0.0102; post hoc Tukey’s test: p(KO veh,WT veh) < 0.0001, p(KO veh,KO 1.0) < 0.0001; d right panel: one-way ANOVA F(4,54) = 6.943, p = 1.6 × 10⁻⁴; post hoc Tukey’s test: p(KO veh,KO 1.0) = 0.00187). By comparison the level of activity in Fmr1 KO mice is not affected by 1.0 mg/kg tat epitope alone (a right panel: post hoc Tukey’s test p(KO veh,KO tat) = 0.937; d right panel: post hoc Tukey’s test p(KO veh,KO tat) = 0.268). Similarly, injection of 1.0 mg/kg FMRP(1–297)-tat in WT animals had no significant effect on distance or velocity for any of the 1, 24, or 48 h time points (left panels for distance: a post hoc Tukey’s test: p(WT veh,WT 1.0) = 0.629; b p(WT veh,WT 1.0) = 0.999; c p(WT veh,WT 1.0) = 0.636; left panels for velocity: d p(WT veh,WT 1.0) = 0.324; e p(WT veh,WT 1.0) = 0.9998; f p(WT veh,WT 1.0) > 0.9999). Animals used for behavioral tests ranged from P55–P100. Average values are mean ± s.e.m, and sample values identified at the base of bar plots represent the number of animals. *p < 0.05, **p < 0.01, ***p < 0.001, NS not significant. Source data are provided as a Source Data file.

