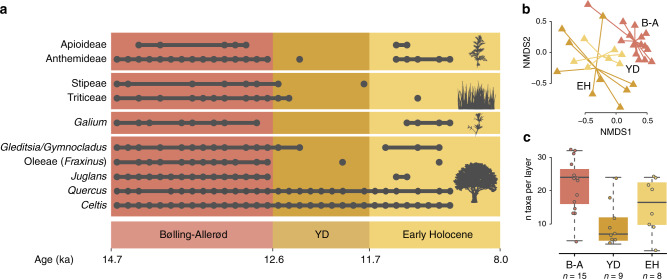
Fig. 4. Plant diversity through time.
Record is based on sedaDNA data of two short chloroplast assays (trnL-gh and rbcL). a Detection of select indicator species through time. It includes data from sequences A and B sorted by age (Supplementary Table 4). b Non-metric multidimensional scaling (NMDS) plot based on presence/absence data of all taxa detected by sedaDNA. c Number of taxa detected per layer for different time periods illustrated with boxplots (centre line: median. Box limits: upper and lower quartiles. Whiskers extend to the extremes of the data, no data points were excluded). A total of 32 biologically independent samples from three time periods were compared: Bølling–Allerød (n = 15), YD (n = 8) and Early Holocene (n = 9). Source data are provided as a Source Data file.

