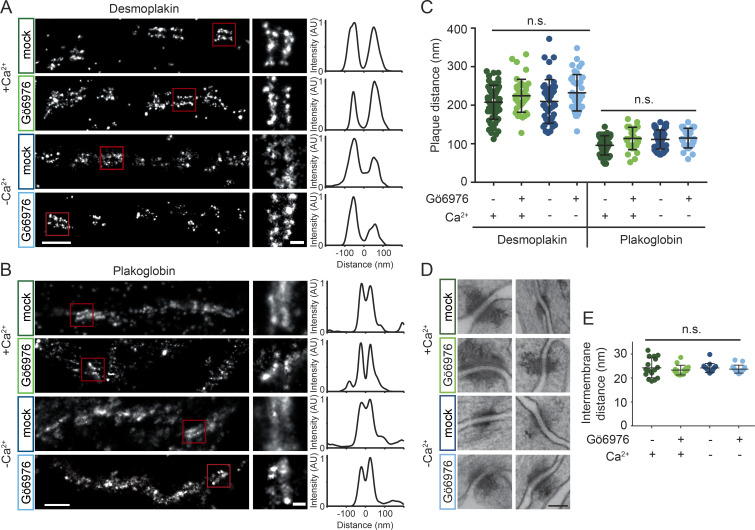
Figure 3.
Desmosome architecture is maintained in Gö6976-induced hyperadhesion. (A and B) HaCaT cells were mock or Gö6976 treated and incubated in normal or low-Ca2+ medium. Cells were stained with antibodies for DP (A) or PG (B) and imaged by dSTORM. Representative cell borders are shown for each condition with single desmosome regions of interest (ROIs) indicated by the red squares. Scale bar = 500 nm; ROI scale bar = 100 nm. Linescans of fluorescence intensity perpendicular to the desmosome axis were used to quantify plaque-to-plaque distance; examples are shown for the ROIs. (C) Quantification of plaque-to-plaque distance shows no significant difference across treatment groups for DP or PG (DP left to right, n = 58, 40, 44, 41; PG left to right n = 41, 30, 48, 31, each from three independent experiments). (D) Electron micrographs of desmosomes under the same treatment conditions. Scale bar = 100 nm. (E) Quantification of intermembrane distance shows no difference across treatment groups (n = 15 desmosomes per group). Bars represent mean ± SD (n.s., not significant, P > 0.05; one-way ANOVA followed by Tukey’s multiple comparison test).

