Figure 4.
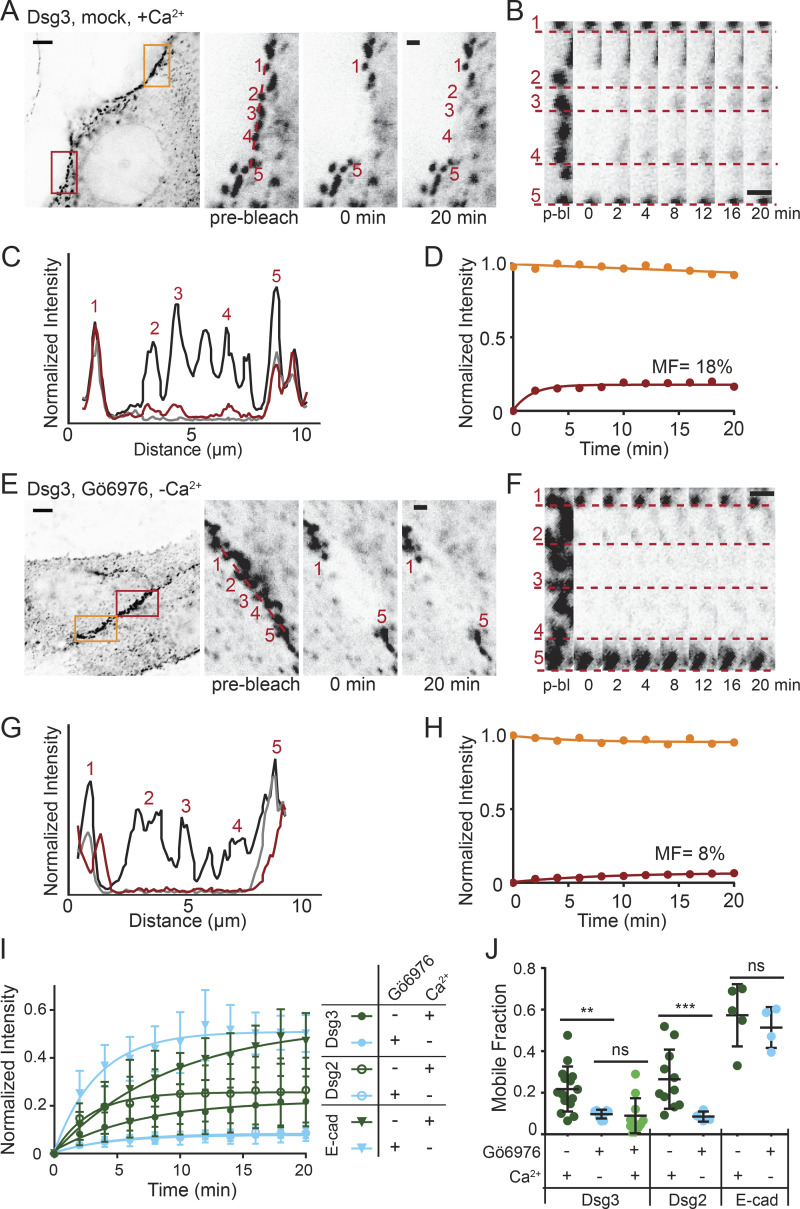
Desmosomal cadherin exchange is reduced in hyperadhesive desmosomes. (A–D) FRAP experiments were conducted on HaCaT cells transfected with Dsg3-ΔEA-GFP and mock treated in normal-Ca2+ medium. (A) Representative cell (inverted intensity) with bleach (red) and reference (orange) regions of interest (ROIs). Bleach ROI shown with individual desmosomal puncta indicated. Scale bar = 5 µm; ROI scale bar = 1 µm. (B) Bleach ROI over time with dashed lines underscoring individual puncta, highlighting recovery. Scale bar = 1 µm. (C) Linescans through the bleach region indicate relative intensities before bleaching (black), immediately after bleaching (gray), and at 20 min after bleaching (red). (D) FRAP recovery curves of the bleach (red) and reference (orange) ROIs. The bleach ROI intensity was fitted to a one-phase association to determine mobile fraction (MF). (E–H) FRAP experiments were conducted on HaCaT cells transfected with Dsg3-ΔEA-GFP, Gö6976 treated, and switched to low-Ca2+ medium for 90 min. (E) Representative cell (inverted intensity) with bleach (red) and reference (orange) ROIs. Bleach ROI shown with individual desmosomal puncta indicated. Scale bar = 5 µm; ROI scale bar = 1 µm. (F) Bleach region over time with dashed lines underscoring individual puncta. Scale bar = 1 µm. (G) Linescans through the bleach region indicate relative intensities before bleaching (black), immediately after bleaching (gray), and at 20 min after bleaching (red). (H) FRAP recovery curves of the bleach (red) and reference (orange) ROIs. The bleach ROI intensity was fitted to a one-phase exponential association to determine the MF. (I) FRAP recovery curves (mean ± SD) for cells transfected with Dsg3-ΔEA-GFP, Dsg2-GFP, or E-Cad-GFP and mock treated in normal Ca2+ (n = 15, 11, 5) or Gö6976 treated in low Ca2+ (n = 11, 10, 4). (J) Mean mobile fraction ± SD for treatments in I and Dsg3-ΔEA-GFP Gö6976 treated in normal Ca2+ (n = 11). All data were acquired from three independent experiments (ns, not significant, P > 0.05; **, P ≤ 0.01; ***, P ≤ 0.001; ANOVA).

