Figure 7.
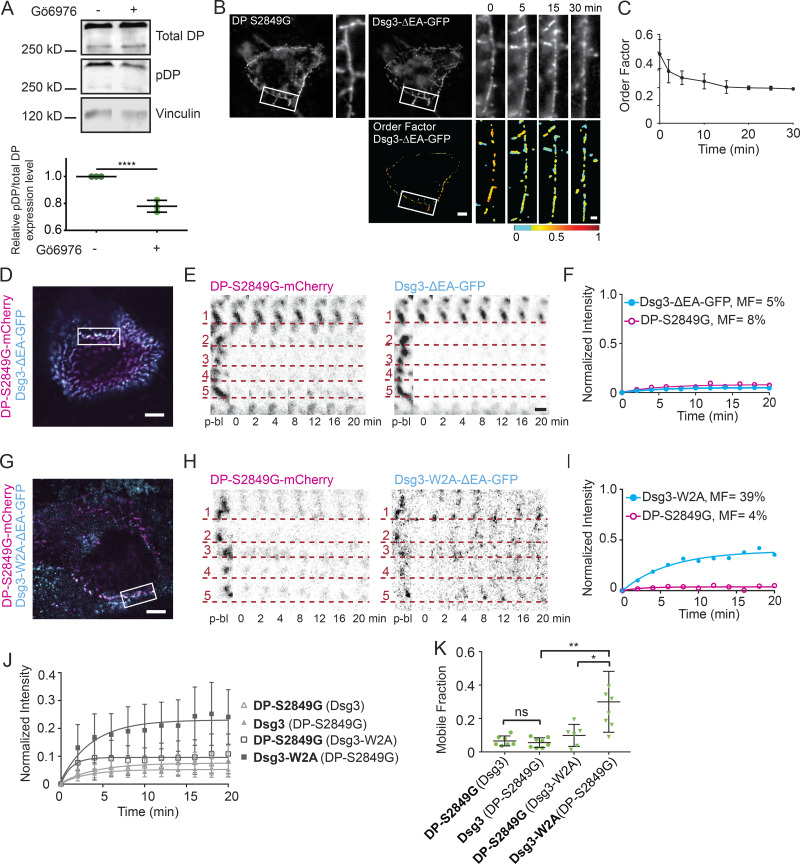
DP S2849G conferred reduced protein exchange. (A) Representative immunoblot and densitometry analysis of total DP and phospho-DP in HaCaT cells mock or Gö6976 treated. For densitometry, the phospho-DP/total DP ratio was normalized to mock treated (****, P < 0.0001 by unpaired t test; data are mean ± SD of three independent experiments). (B and C) HaCaT cells were cotransfected with Dsg3-ΔEA-GFP and DP-S2849G-mCherry, switched from normal to low-Ca2+ medium, and imaged with fluorescence polarization microscopy. (B) Representative cell fluorescence and order factor images over time (scale bar = 5 µm; region of interest [ROI] scale bar = 1 µm). (C) Mean Dsg3-ΔEA-GFP order factor over time (mean ± SD; n = 8 cells). (D) Representative cell expressing DP-S2849G-mCherry (magenta) and Dsg3-ΔEA-GFP (cyan) with bleach ROI indicated. Scale bar = 5 µm. (E) ROI (inverted intensity) with dotted lines underscoring individual puncta of DP-S2849G-mCherry and Dsg3-ΔEA-GFP over the time course (scale bar = 1 µm). (F) Bleach ROI of DP-S2849G-mCherry and Dsg3-ΔEA-GFP intensity plotted as a function of time and fitted to a one-phase association. (G) Representative cell expressing DP-S2849G-mCherry (magenta) and Dsg3-W2A-ΔEA-GFP (cyan) with bleach ROI indicated. Scale bar = 5 µm. (H) ROI (inverted intensity) with dotted lines underscoring individual puncta of DP-S2849G-mCherry and Dsg3-W2A-ΔEA-GFP over the time course (scale bar = 1 µm). (I) Bleach ROI of DP-S2849G-mCherry and Dsg3-W2A-ΔEA-GFP intensity plotted as a function of time and fitted to a one-phase association. (J and K) Normalized intensity over time fitted to a one-phase association (mean ± SD; J) and mobile fraction (mean ± SD; K) for cotransfections with quantified protein in bold and coexpressed protein in parentheses. DP-S2849G-mCherry (Dsg3-ΔEA-GFP; n = 8) and Dsg3-ΔEA-GFP (DP-S2849G-mCherry; n = 8) and DP-S2849G-mCherry (Dsg3-W2A-ΔEA-GFP; n = 6) and Dsg3-W2A-ΔEA-GFP (DP-S2849G-mCherry; n = 8). All data from three independent experiments (ns, not significant, P > 0.05; *, P ≤ 0.05; **, P ≤ 0.01; ANOVA).

