Figure S1.
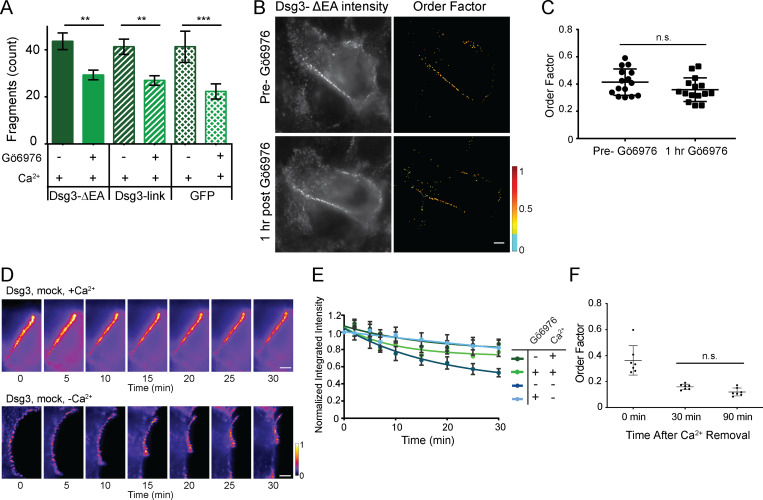
Fluorescence polarization microscopy controls. (A) Dispase fragmentation assay for cells expressing Dsg3-ΔEA-GFP, Dsg3-link-GFP, or GFP. Dsg3-ΔEA-GFP did not impact adhesive strength or the ability to acquire hyperadhesion (n = 3; mean ± SD). (B and C) HaCaT cells transfected with Dsg3-ΔEA-GFP were imaged by fluorescence polarization microscopy before and 1 h after treatment with Gö6976 while maintained in normal-Ca2+ medium. (B) Representative intensity and order factor images. Scale bar = 5 µm. (C) Order factor quantification (mean ± SD; n = 15 cells; n.s., not significant P > 0.05; Student’s t test). (D) HaCaT cells were transfected with Dsg3-ΔEA-GFP, mock treated, maintained in normal-Ca2+ medium (top) or switched to low-Ca2+ medium (bottom), and imaged for 30 min. Representative intensity images at each time point are shown. Scale bar = 5 µm. (E) Intensity over time was quantified by masking each image and calculating the integrated intensity. Integrated intensity was normalized and averaged across the population of cells (D and E are the same cells with analysis presented in Fig 1; normal-Ca2+ medium mock [n = 6] or Gö6976 [n = 6] treated; low-Ca2+ medium mock [n = 11] or Gö6976 [n = 15] treated; mean ± SEM). (F) Order factor from Gö6976-treated cells fixed at 0, 30, or 90 min after the switch to low-Ca2+ medium (mean ± SD). Order factor was not significantly different at 30 or 90 min in low Ca2+ (n = 7 cells each condition; n.s., not significant P > 0.05; ANOVA).

