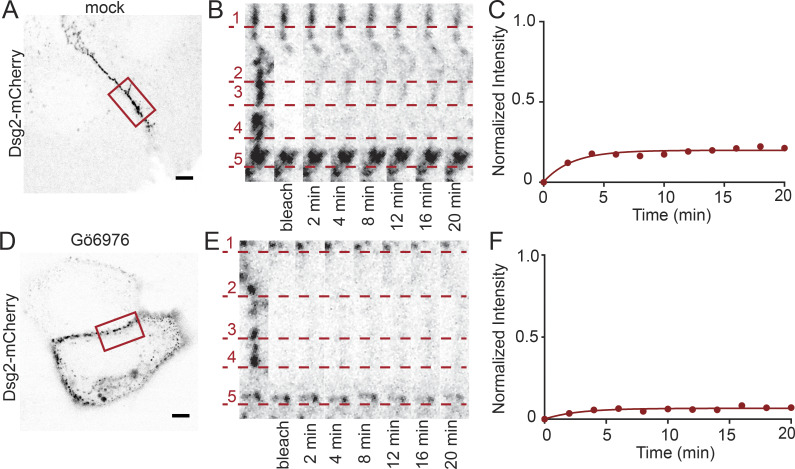
Figure S2.
Representative images of cells expressing Dsg2-mCherry showing that exchange is reduced in hyperadhesion. Representative cells from data presented in Fig 4. (A) HaCaT cell transfected with Dsg2-mCherry, mock treated, and maintained in normal Ca2+ with bleach region of interest (ROI) indicated. Scale bar = 5 µm. (B) Zoom-in of cell border in bleach ROI over time. Recovery of individual puncta is underscored by the dashed lines. (C) Fluorescence intensity plotted as a function of time. Mobile fraction = 20%. (D) Representative HaCaT cell transfected with Dsg2-mCherry, Gö6976 treated, and maintained in low-Ca2+ medium for 90 min. Scale bar = 5 µm. (E) Zoom-in of cell border in bleach ROI over time with individual puncta underscored by the dashed lines. (F) Fluorescence intensity plotted as a function of time. Mobile fraction = 7%.

