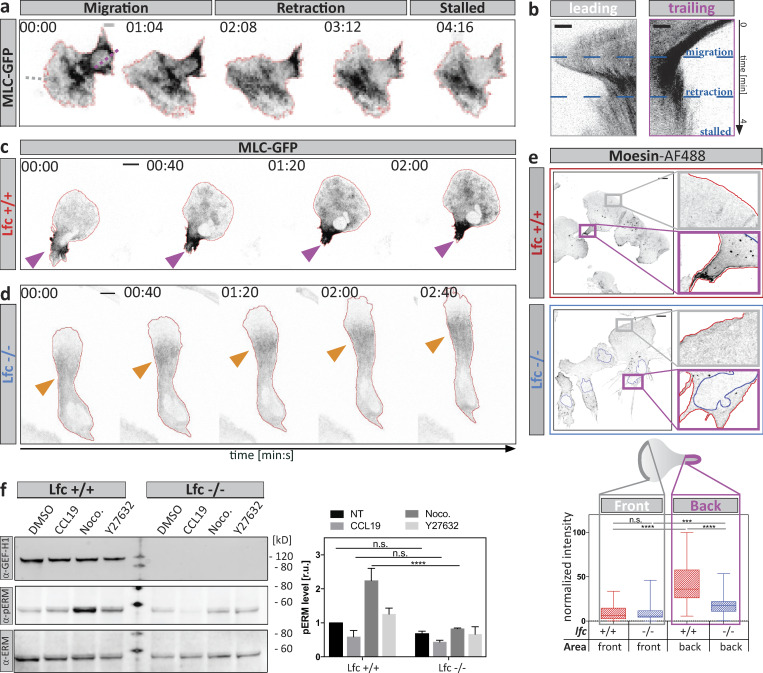
Figure S4.
Aberrant spatiotemporal MLC accumulation and moesin localization in Lfc−/− DCs. (a) Time-lapse montage of an MLC-GFP–expressing DC migrating under agarose toward a soluble CCL19 gradient. A cycle of migration, retraction, and pausing is shown. Scale bar, 10 µm. Dotted lines indicate positions further analyzed by kymographs in b. (b) Leading edge kymograph was derived from gray dotted line in leading edge region of panel a. Trailing edge kymograph was derived from purple dotted line in trailing edge region of panel a. Note the absence of MLC accumulation in leading edge areas and the presence of trailing edge MLC accumulation during the migration. Scale bar, 5 µm. (c and d) Time-lapse sequence showing spatiotemporal MLC accumulation of Lfc+/+ (c) and Lfc−/− (d) DCs. Purple arrowheads highlight the trailing edge MLC accumulation, and orange arrowheads indicate central MLC accumulation. Scale bars, 10 µm. (e) Quantitative morphometry of moesin in fixed migratory Lfc+/+ (red) and Lfc−/− (blue) DCs. Lower panel: Quantification of fluorescence intensity in the leading versus trailing edge regions of Lfc+/+ (red) and Lfc−/− (blue) DCs of n = 55 cells per condition from N = 3 experiments. Boxes extend from 25th to 75th percentiles. Whiskers span minimum to maximum values. ***, P ≤ 0.001; ****, P ≤ 0.0001. Scale bars, 10 µm. (f) Protein levels of phospho-ERM (pERM) in Lfc+/+ and Lfc−/− DCs assessed by Western blot analysis. Right panel: Quantification of pERM levels upon treatment with DMSO, CCL19, nocodazole (Noco.), or Y27632. Mean fluorescence intensity of pERM signal was normalized to total ERM signal and shown as fold increase relative to Lfc+/+ DMSO control ± SD of N = 3 experiments. Annotation above columns indicates results of two-way ANOVA; ****, P ≤ 0.0001. n.s., not significant; r.u., relative units; NT, non-treated; ERM, Ezrin/Radixin/Moesin.

