Figure 1.
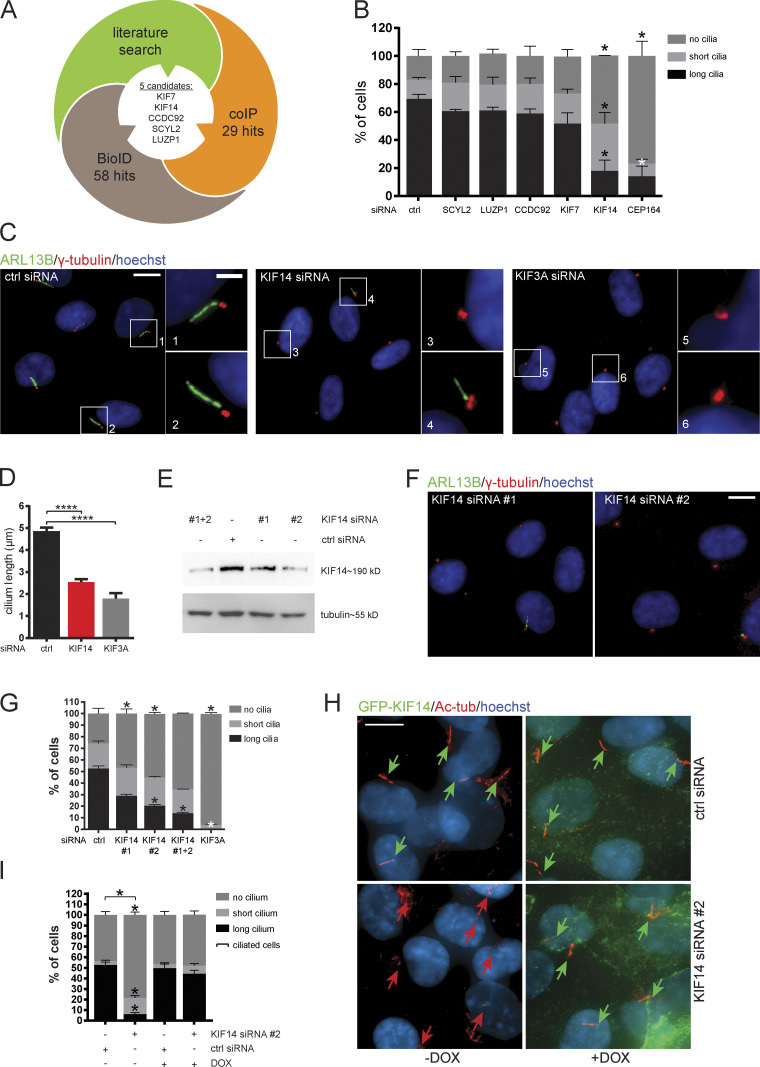
KIF14 knockdown causes ciliogenesis defects. (A) Graphical summary illustrating rational behind the selection of candidates. (B–H) hTERT RPE-1 cells were transfected with indicated siRNA and 24 h serum starved. (B) Quantification of ARL13B+ primary cilia formation. CEP164 siRNA was used as a positive control. For SCYL2 and CEP164 silencing, we used single siRNA oligos; for LUZP1, CCDC92, KIF7, and KIF14, we used a 50 nM mix of oligos 1 and 2 (Table S3). (C) Representative images of immunofluorescent staining of ARL13B (green), γ-tubulin (red), and DNA (blue); scale bar, 10 µm (crops 1 and 2 show examples of “long” primary cilia; crop 3 shows “no” cilium; and crop 4 shows a “short” primary cilium; scale bar, 2 µm). Silencing of KIF3A was used as a positive control. (D) Graph of cilia length (only cells with ciliary axoneme are included). (E–G) Test of KIF14 knockdown efficiency using different siRNA oligos. (E) Western blot analysis of protein expression in total hTERT RPE-1 cell lysates. (F) Representative images of IF staining of ARL13B (green), γ-tubulin (red), and DNA (blue); scale bar, 10 µm. (G) Quantification of ARL13B+ primary cilia formation after KIF14 knockdown using different siRNA oligos. KIF3A siRNA was used as a positive control. (H) IF staining of ciliogenesis defects rescue, caused by KIF14 siRNA #2–mediated depletion, by expression of GFP-KIF14si2res upon DOX induction (GFP-KIF14, green; Ac-tub, red; and DNA, blue); scale bar, 10 µm. Green arrows point to long primary cilia (>3.3 µm), and red arrows point to short primary cilia (<3.3 µm). (I) Quantification of ciliogenesis rescue. Note that ciliated cells here refer to a sum of short-cilium and long-cilium cells. Asterisks indicate statistical significance determined using an unpaired t test (D and I; ciliated cells = short + long) or the Holm–Sidak method (B, G, and I; categories).

