Figure 3.
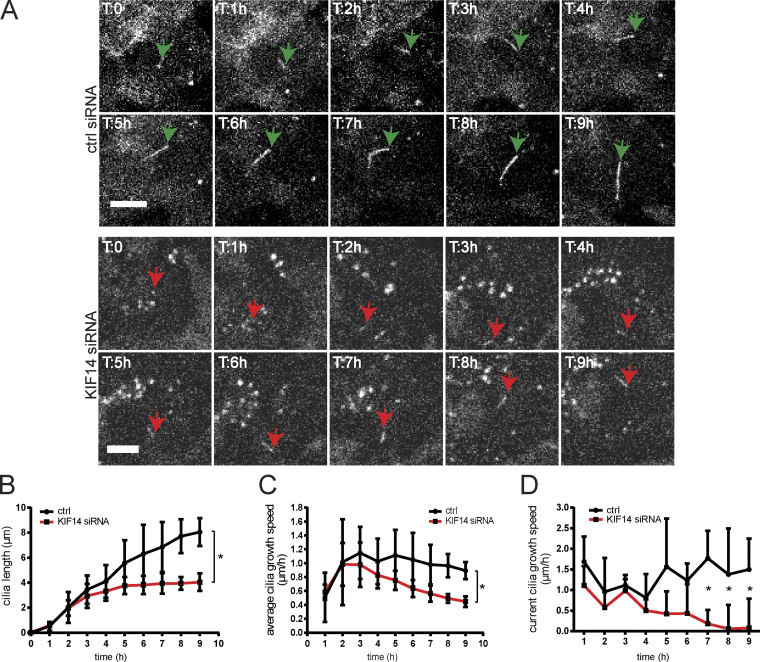
KIF14 depletion affects dynamics of primary cilia growth. (A–D) Time-lapse imaging microscopy analyses of ciliogenesis in stable GFP-ARL13B hTERT RPE-1 during 9 h after serum starvation. (A) Representative stills of control or KIF14 siRNA-transfected cells; scale bars, 20 µm (ctrl siRNA) and 10 µm (KIF14 siRNA). Green arrows point to long (control) primary cilia, and red arrows point to short primary cilia. T indicates time in hours. (B) Quantification of cilia length during time-lapse microscopy of GFP-ARL13B+ primary cilia. Note the increasing difference between control and KIF14-depleted cells at later time points. (C and D) Measurements of the speed of ciliary axoneme elongation. The average primary cilia growth speed (µm/h) reflects actual PC length reached at the indicated time (C), and the current primary cilia speed of growth (µm/h) represents an increment of length per hour (D). Asterisks indicate statistical significance determined using an unpaired t test.

