Figure 4.
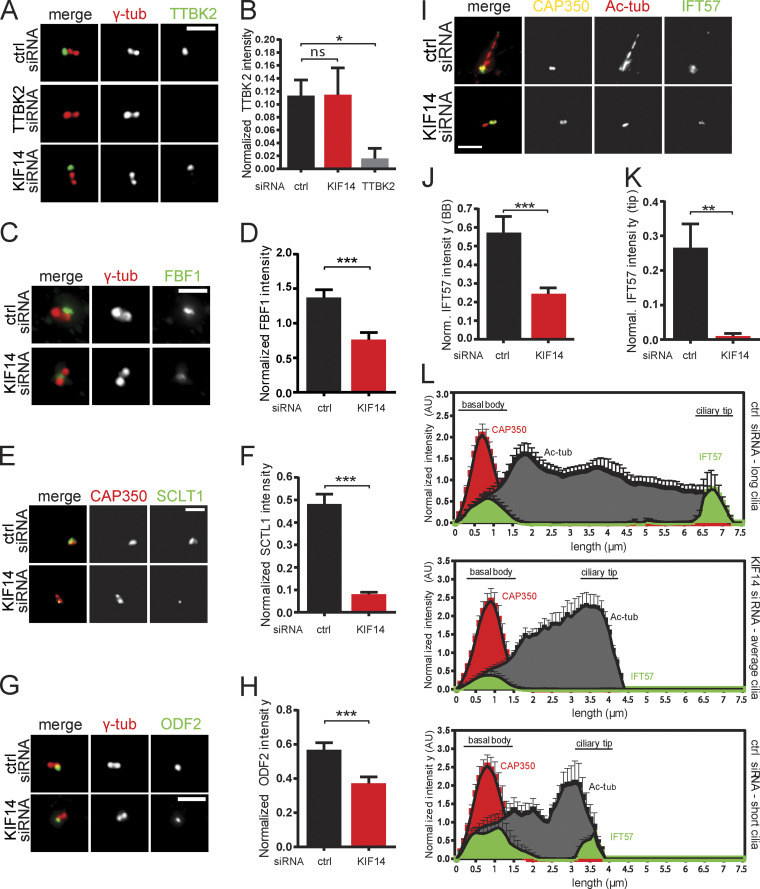
KIF14 knockdown affects BB components and IFT-B anterograde transport. hTERT RPE-1 cells were transfected with the indicated siRNA, serum starved for 24 h, and analyzed by IF microscopy. γ-tubulin or CAP350 staining was used to visualize centrosomes, and Ac-tub staining detected primary cilia. (A) TTBK2 localization (green) is not affected by KIF14 depletion (TTBK2 siRNA knockdown was used as a positive control); γ-tubulin, red; scale bar, 2 µm. (B) Quantification of TTBK2 signal (normalized to γ-tubulin). (C) FBF1 protein intensity (green) is significantly affected by KIF14 depletion; γ-tubulin, red; scale bar, 2 µm. (D) Quantification of FBF1 signal (normalized to γ-tubulin). (E) SCLT1 protein intensity (green) is significantly affected by KIF14 depletion; CAP350, red; scale bar, 2 µm. (F) Quantification of SCLT1 signal (normalized to CAP350). (G) ODF2 protein intensity (green) is significantly affected by KIF14 depletion; γ-tubulin, red; scale bar, 2 µm. (H) Quantification of ODF2 signal (normalized to γ-tubulin). (I) Localization of IFT57 (green) is significantly different after KIF14 depletion (CAP350, yellow; Ac-tubulin, red); scale bar, 3 µm. (J and K) Quantification of IFT57 signal at BBs (J; "norm." means normalized to CAP350) and in the ciliary tip (K; "normal." means normalized to CAP350). (L) Histograms showing distribution of IFT57 (green), CAP350 (red), and Ac-tub (gray) and its signal intensities along primary cilia. Quantification was done for typical "control long" cilia and "short" defective cilia after KIF14 siRNA (N = 10) and for additional control also within a subset of short primary cilia in controls (N = 5). Asterisks or “ns” indicates statistical significance determined by unpaired t test (ns, not significant).

