Figure 7.
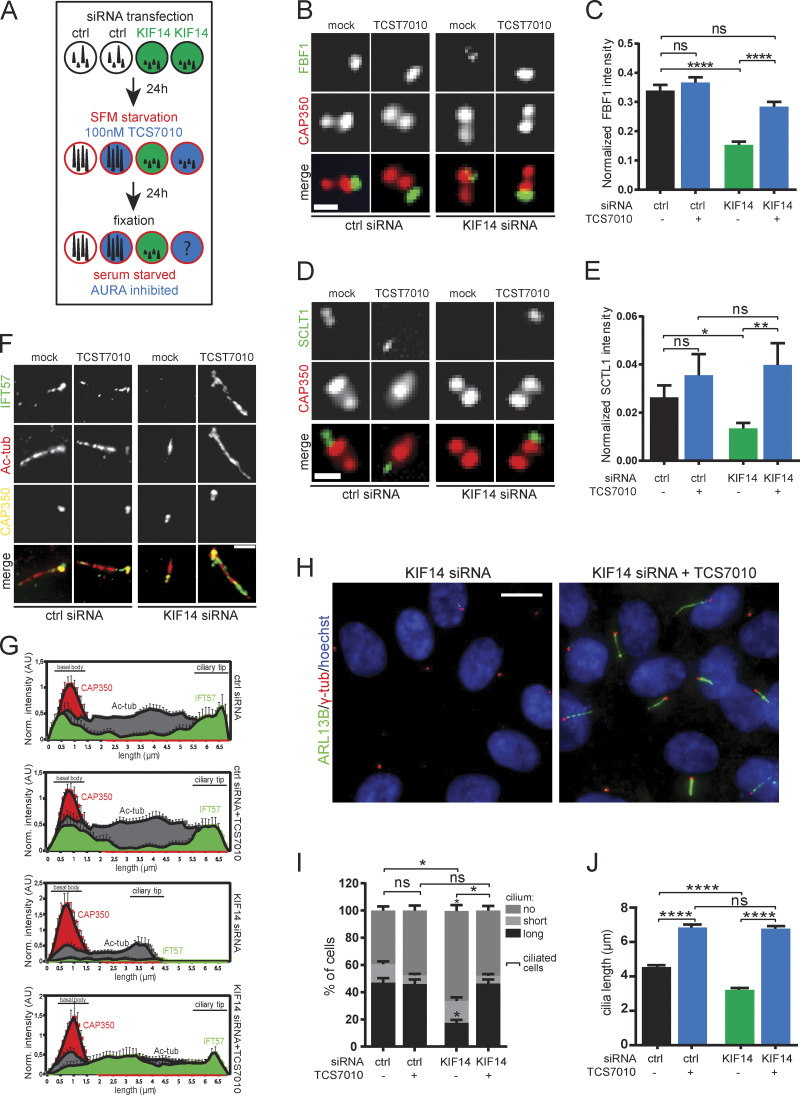
AURA activity mediates effects of KIF14 depletion on primary cilia formation. (A) Experimental design of KIF14 siRNA effects rescue using 100 nM TCS7010 (AURA inhibitor). (B–J) hTERT RPE-1 cells were transfected with indicated siRNA 48 h before fixation and last 24 h serum starved and AURA inhibited by TCS7010. (B and C) Examination of FBF1 (green) localization and intensity. Representative images (CAP350 in red; scale bar, 1 µm) are shown in B and intensity quantification (normalized to CAP350) in C. (D and E) Examination of SCLT1 (green) localization and intensity. Representative images (CAP350 in red; scale bar, 1 µm) are shown in D and intensity quantification (normalized to CAP350) in E. (F and G) Examination of IFT57 (green) localization and intensity. Representative images (CAP350 in yellow, Ac-tub in red; scale bar, 2 µm) are shown in F and intensity quantification histograms (normalized to CAP350; N = 5) in G ("norm." means normalized to CAP350). (H) Representative images of AURA inhibition rescue experiment of ciliogenesis defect caused by KIF14 knockdown. Detection of ARL13B+ primary cilia (green; γ-tubulin, red; DNA, blue); scale bar, 10 µm. (I) Quantification of ARL13B+ primary cilia formation. (J) Effects on ARL13B+ primary cilia length. Asterisks or "ns" indicates statistical significance determined using Tukey's multiple comparisons test (C, E, and J), an unpaired t test (I; ciliated cells = short + long), or the Holm–Sidak method (I; categories).

