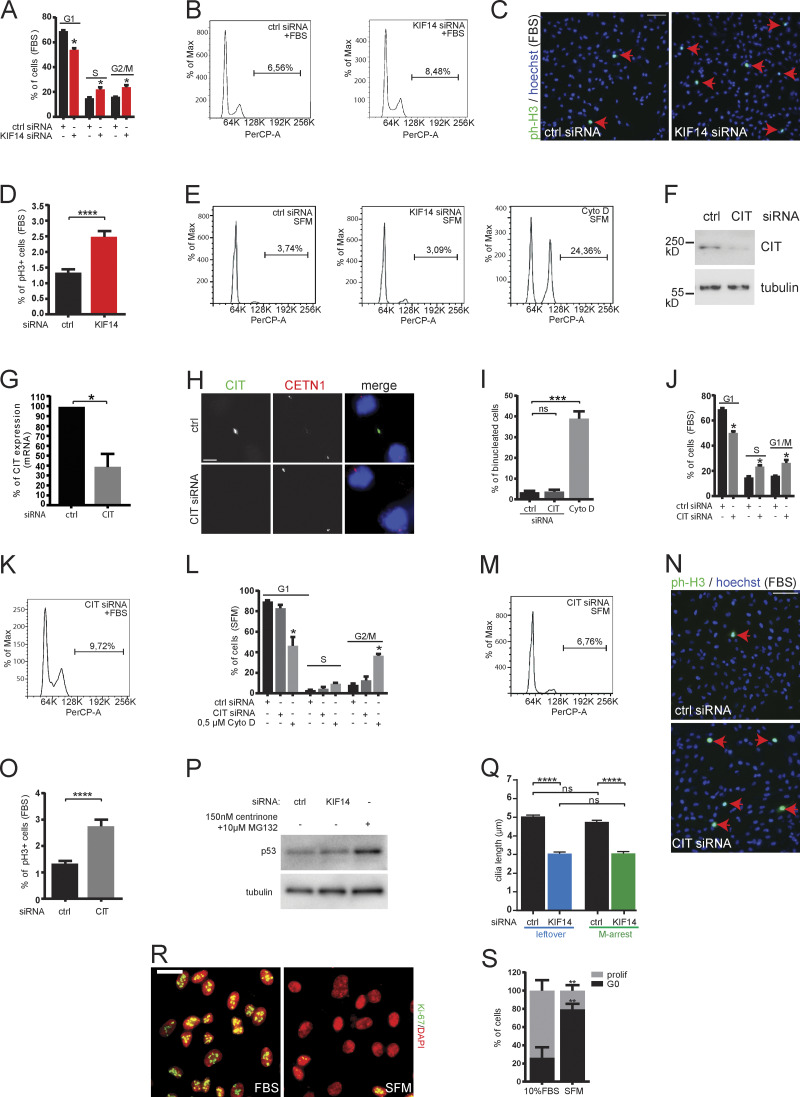
Figure S3.
KIF14 and CIT knockdown leads to minor effects on cell cycle in RPE-1, related to Fig. 5, A–E. Cell cycle analyses demonstrating distribution of hTERT RPE-1 cells 48 h transfected with control or KIF14 siRNA and 24 h proliferating in normal 10% FBS medium (A–D) or serum starved (E). (A and B) Graph (A) and histograms (B) of flow cytometry analysis of cycling cells show minor increase of G2/M cells (quantification indicates increased ploidy = cells with >G2/M DNA content). (C and D) Representative images (C; phospho-histone H3 in green and DNA in blue; scale bar, 100 µm) and graph of quantification (D) show minor increment of phospho-histon H3 positive (ph-H3+) proliferating cells. (E) Histograms of flow cytometry analyses quantified in Fig. 5 B graph. (F–H) Validation of CIT siRNA knockdown efficiency in hTERT RPE-1 cells by Western blot analysis on protein level (F) and quantitative RT-PCR analysis of CIT mRNA depletion (G). (H) Representative images of IF microscopy detecting CIT (green), CETN1 (red), and DNA (blue); scale bar, 5 µm. (I–O) Cell cycle analyses demonstrating distribution of hTERT RPE-1 cells 48 h transfected with control or CIT siRNA and proliferating for 24 h in normal 10% FBS medium (J, K, N, and O) or serum starved (I and L–M). (I) Quantification of percentage of binucleated cells (cytochalasin D treatment was used as positive control). (J–M) Flow cytometry cell cycle analyses demonstrating minor increase in proportion of G2/M phase in 10% FBS and unaffected G2/M proportion in serum-starved conditions (quantification indicates increased ploidy = cells with >G2/M DNA content). (N and O) Representative images of ph-H3 (green) and DNA (blue) IF staining show minor increase of proliferating cells after CIT depletion in 10% FBS condition; scale bar, 100 µm (quantified in O). (P) P53 Western blot analysis of whole hTERT RPE-1 cell lysates transfected for 48 h with control or KIF14 siRNA (150 nM centrinone + 10 µM MG132 treatment was used as positive control). (Q) Graph showing ARL13B+ cilia length (related to Fig. 5, E and F; please see scheme of the experiment in Fig. 5 E). (R and S) Analysis of effectivity of serum starvation to synchronize hTERT RPE-1 cells in G0 phase (related to Fig. 5, G–J). (R) Representative images show IF staining detecting the proliferation marker Ki-67 (green) and DNA (red); scale bar, 20 µm. (S) Quantification of proportion of cells synchronized in G0 (Ki-67+). Asterisks or "ns" indicate statistical significance determined using an unpaired t test.

