Figure S2.
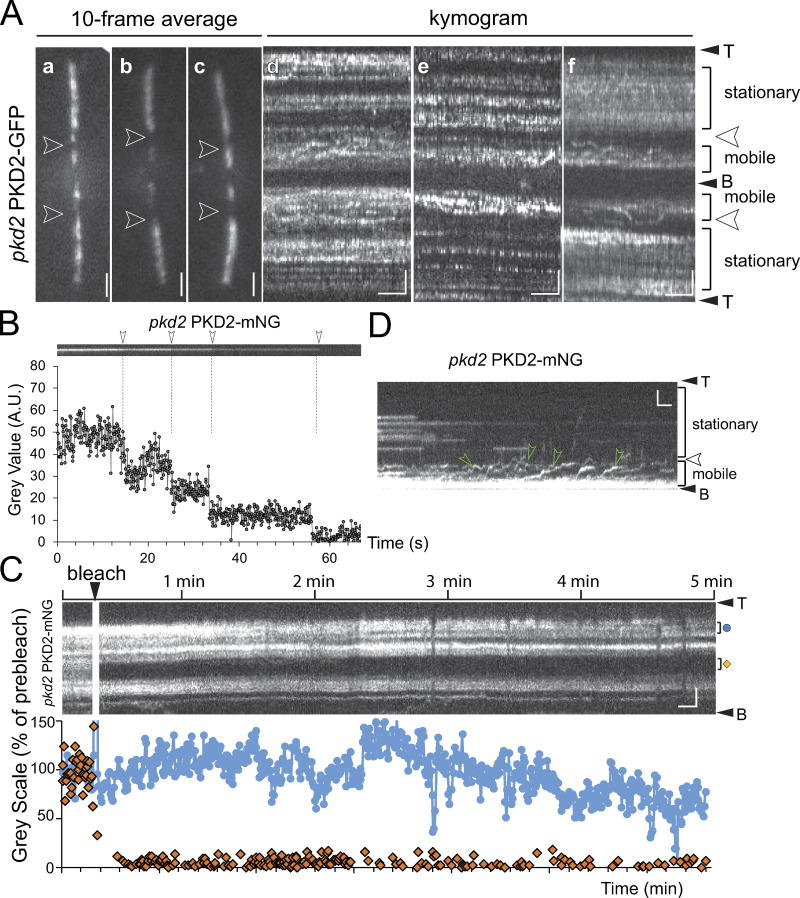
Compartmentalization of PKD2-FP in cilia. (A) Galleries of still images (a–c) and kymograms (d–f) of the cilia of pkd2 PKD2-GFP cells. The mobile and stationary regions of PKD2-GFP are indicated. Arrowheads, PKD2-GFP exclusion zone. Bars = 2 µm (a–c); 2 s and 2 µm (d–f). (B) Kymogram (top) and signal quantification (bottom) of one PKD2-mNG particle in the cilium of a pkd2 PKD2-mNG rescue cell during bleaching; arrowheads and dashed lines mark the bleaching steps. (C) FRAP analysis of ciliary PKD2-mNG in pkd2 PKD2-mNG. Top: Kymogram of the pre- and postbleach signals. The regions used to quantify the intensity in the bleached area (orange diamond) and an unbleached control area (blue dot) are marked. Bottom: Plot of signal intensity in percentage of the prebleach intensity of the bleached and the control region. Bars = 2 s and 2 µm. (D) Kymogram showing the dynamics of PKD2-mNG in the proximal cilium. The cilium was partially photobleached to better visualize PKD2-mNG moving in the mobile region. Green arrowheads indicate diffusing PKD2-mNG. Bars = 2 s and 2 µm.

