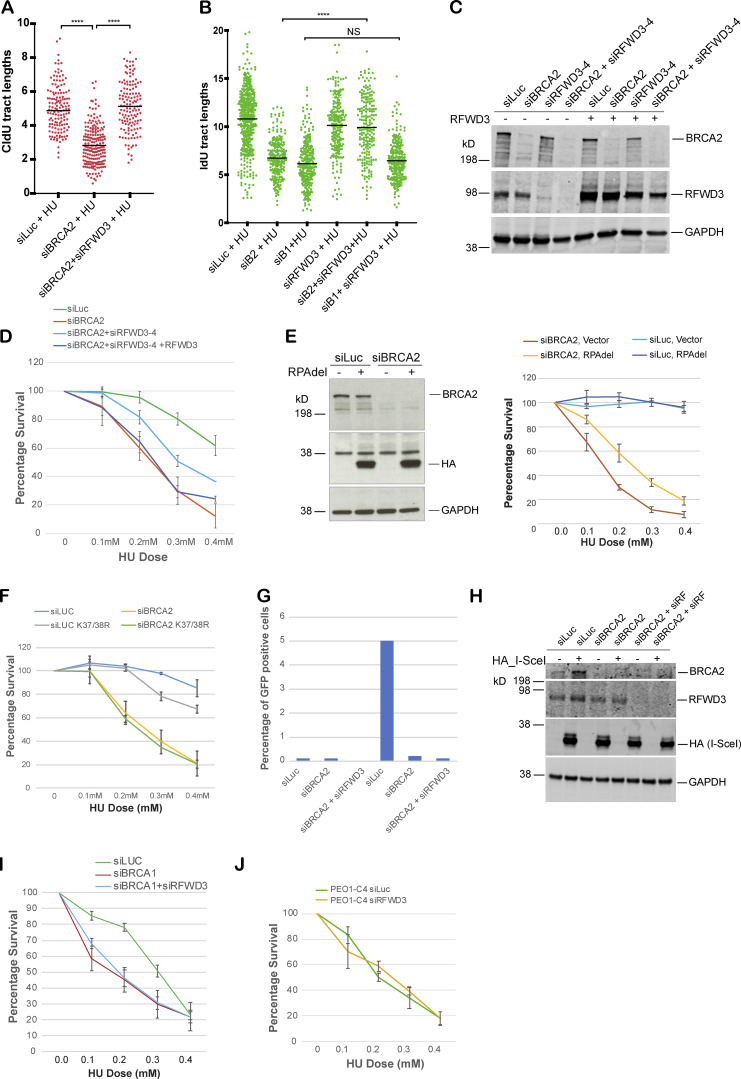
Figure S4.
RFWD3 depletion rescues fork degradation, fork collapse, and cell sensitivity to stalled fork–inducing agents in BRCA2-depleted cells and BRCA2 mutant tumor cells. (A) Fork restart analysis. Scatterplots compare the tract lengths of CldU in cells treated with different siRNAs and in the presence of HU, with black horizontal lines indicating the median of all the tracts counted (>200). ****, P < 0.0005. (B) Scatterplots compare the tract lengths of IdU in U2OS cells transfected with different siRNAs and in the presence of HU, with black horizontal lines indicating the median of all the tracts counted (>200). ****, P < 0.0005. (C) Western blot shows expression level of indicated proteins in control (siLuc), BRCA2-depleted (siBRCA2), and BRCA2- and RFWD3-codepleted (siBRCA2+siRFWD3) cells. (D) CellTiter-Glo–based cell survival assay was used to determine the sensitivity of BRCA2- and RFWD3-codepleted cells to HU after reconstituting these cells with WT RFWD3. (E and F) CellTiter-Glo–based cell survival assay was used to determine the sensitivity of BRCA2-depleted cells expressing truncated (lacking residues 243–262) “Del” HA-RPA32 (E) or K37/38R mutant of the RPA32 (F) to HU. (G and H) HR assay to determine HR efficiency. U2OS cell line with a stably integrated DRGFP reporter was used for this assay. Cells were transfected with HA-tagged I-SceI–expressing plasmid to induce DSBs. Graph indicates percentage of GFP-positive cells transfected with control (siLuc), BRCA2, RFWD3, or BRCA2 and RFWD3 together. GFP was detected by flow cytometry. (I) Loss of RFWD3 does not rescue sensitivity of BRCA1-depleted cells to HU. CellTiter-Glo–based cell survival assay was used to determine the sensitivity of BRCA1- and RFWD3-codepleted cells to HU. (J) CellTiter-Glo–based cell survival assay was used to determine the sensitivity of PEO1-C4 to HU after depletion of RFWD3. PEO1-C4 is a BRCA2-proficient ovarian cancer cell line. Error bars indicate SD between triplicates. Related to Fig. 6.

